OPEN-SOURCE SCRIPT
ATR% Credit Spread Strike Guide
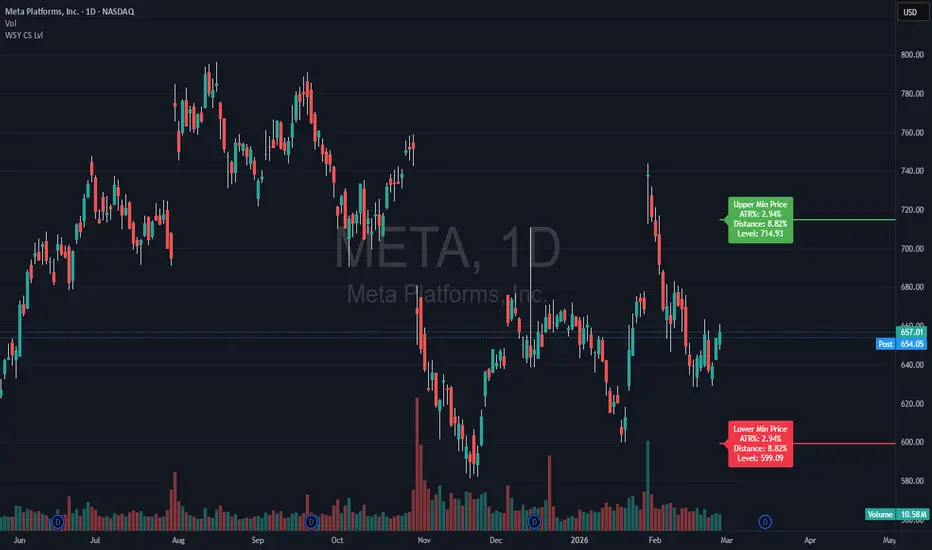
This indicator helps options traders quickly estimate the **nearest reasonable short strike area** for a credit spread using an **ATR-based distance model**.
It calculates the stock’s current **ATR%** and applies a user-defined multiple, then plots horizontal reference levels from the current price:
* **Lower Min Price** for the put side, useful when evaluating **bull put spreads**
* **Upper Min Price** for the call side, useful when evaluating **bear call spreads**
The goal is simple: instead of using a flat percentage for every stock, this tool adjusts the minimum strike distance based on the stock’s recent daily movement.
### How it works
* Uses **ATR over a selectable lookback period** (default: 20)
* Converts that movement into a percentage of price
* Applies a selectable **ATR% multiple** (1x to 4x, default: 3x)
* Draws a **horizontal line** at the current upper and/or lower threshold
* Optional labels show:
* ATR%
* Total distance %
* Current level price
### Why use it
A flat 5% rule can be too tight for volatile names and too wide for calmer names. This script gives a faster way to visualize a volatility-adjusted threshold before checking the actual option chain.
### Practical use
* Use the plotted level as the **closest strike area worth considering**
* Then confirm:
* option premium is acceptable
* return on risk meets your plan
* the strike still makes sense relative to expected move, trend, and support/resistance
### Important note
This is a **charting aid**, not a trade signal. It does not account for implied volatility, expected move, liquidity, earnings risk, assignment risk, or probability of touch. Always confirm with the option chain
It calculates the stock’s current **ATR%** and applies a user-defined multiple, then plots horizontal reference levels from the current price:
* **Lower Min Price** for the put side, useful when evaluating **bull put spreads**
* **Upper Min Price** for the call side, useful when evaluating **bear call spreads**
The goal is simple: instead of using a flat percentage for every stock, this tool adjusts the minimum strike distance based on the stock’s recent daily movement.
### How it works
* Uses **ATR over a selectable lookback period** (default: 20)
* Converts that movement into a percentage of price
* Applies a selectable **ATR% multiple** (1x to 4x, default: 3x)
* Draws a **horizontal line** at the current upper and/or lower threshold
* Optional labels show:
* ATR%
* Total distance %
* Current level price
### Why use it
A flat 5% rule can be too tight for volatile names and too wide for calmer names. This script gives a faster way to visualize a volatility-adjusted threshold before checking the actual option chain.
### Practical use
* Use the plotted level as the **closest strike area worth considering**
* Then confirm:
* option premium is acceptable
* return on risk meets your plan
* the strike still makes sense relative to expected move, trend, and support/resistance
### Important note
This is a **charting aid**, not a trade signal. It does not account for implied volatility, expected move, liquidity, earnings risk, assignment risk, or probability of touch. Always confirm with the option chain
開源腳本
秉持TradingView一貫精神,這個腳本的創作者將其設為開源,以便交易者檢視並驗證其功能。向作者致敬!您可以免費使用此腳本,但請注意,重新發佈代碼需遵守我們的社群規範。

Difficult Takes a day, Impossible Takes a Week!
免責聲明
這些資訊和出版物並非旨在提供,也不構成TradingView提供或認可的任何形式的財務、投資、交易或其他類型的建議或推薦。請閱讀使用條款以了解更多資訊。
開源腳本
秉持TradingView一貫精神,這個腳本的創作者將其設為開源,以便交易者檢視並驗證其功能。向作者致敬!您可以免費使用此腳本,但請注意,重新發佈代碼需遵守我們的社群規範。
Difficult Takes a day, Impossible Takes a Week!
免責聲明
這些資訊和出版物並非旨在提供,也不構成TradingView提供或認可的任何形式的財務、投資、交易或其他類型的建議或推薦。請閱讀使用條款以了解更多資訊。