VWAP Multisession Ultimate
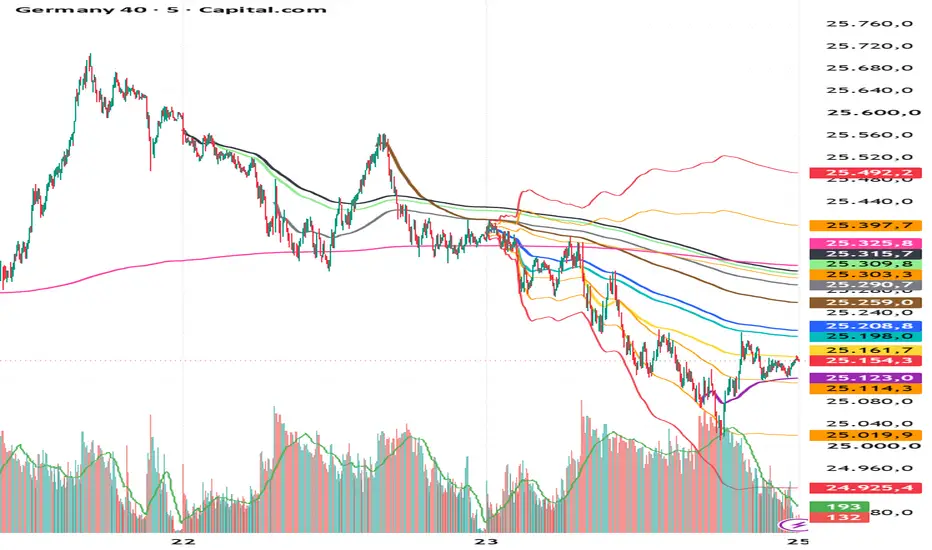
Multi-Session VWAP — Today, Previous Day & Weekly
This indicator displays independent volume-weighted average price curves for Asia, London/Europe, New York, and the full trading day. It combines today’s VWAPs with continuously developing VWAPs anchored to the previous day, plus a weekly VWAP and standard deviation bands around today’s daily VWAP.
Today’s VWAPs
Each VWAP starts at its own anchor time and continues incorporating chart volume until midnight in the Europe/Berlin time zone.
Default settings:
VWAP Start time Color
Asia 02:30 Europe/Berlin Turquoise
London/Europe 09:00 Europe/Berlin Yellow
New York 09:30 America/New_York Purple
Daily 00:00 Europe/Berlin Blue
The session start times are adjustable. New York uses its local time zone, automatically accounting for daylight saving time and the weeks when US and European clock changes differ.
These names identify the starting anchors. The calculations continue beyond the corresponding cash-session closing times.
Previous-Day VWAPs
Previous-day VWAPs retain their original anchors and continue incorporating the current day’s volume. They therefore remain dynamic throughout the current day.
Previous-day VWAP Color
Asia Light green
London/Europe Gray
New York Brown
Daily, anchored at 00:00 Black
At each daily rollover, today’s VWAPs become the new previous-day VWAPs, and the older curves disappear. Only the current and previous day’s curves are retained.
For markets without weekend bars, Friday’s VWAPs carry over into Monday and continue incorporating Monday’s volume. On Tuesday, Monday’s VWAPs replace them. This exception applies specifically to Friday–Monday; other holiday gaps are not automatically bridged.
Weekly VWAP
The pink weekly VWAP accumulates valid chart volume from Monday through Friday, using Europe/Berlin calendar boundaries. Only the current week’s curve is displayed. It resets when the first available bar of the new week arrives.
Daily VWAP Extension Bands
Today’s blue daily VWAP includes three pairs of volume-weighted standard deviation bands:
- Orange: +1 and −1 standard deviation.
- Orange: +2 and −2 standard deviations.
- Red: +3 and −3 standard deviations.
The bands reset with the daily VWAP at midnight in Europe/Berlin. Their multipliers, colors, visibility, and line width are adjustable. Bands are calculated only for today’s daily VWAP.
Calculation and Display
All VWAPs use the chart’s own HLC3 price and volume:
VWAP = Σ(HLC3 × Volume) / Σ(Volume)
Each curve has independent accumulators. Missing or invalid data is skipped without substituting artificial volume. Results may differ between symbols and data providers.
Current values for enabled VWAPs and bands are available on the price scale, status line, and Data Window, subject to TradingView’s display settings. Colors, visibility, and line widths can be customized.
Usage Notes
Use standard time-based intraday charts of 1 minute or higher. Sufficient chart history must be loaded to calculate the selected anchors accurately. Bars are assigned by their opening timestamps and are not split across time boundaries.
VWAPs and bands update while the current candle is open. Previous-day curves also change as new current-day volume is added. Older curves are intentionally removed during daily and weekly rollovers.
The indicator provides reference curves for chart analysis. It does not generate buy or sell signals, alerts, or automated trading orders.
This indicator displays independent volume-weighted average price curves for Asia, London/Europe, New York, and the full trading day. It combines today’s VWAPs with continuously developing VWAPs anchored to the previous day, plus a weekly VWAP and standard deviation bands around today’s daily VWAP.
Today’s VWAPs
Each VWAP starts at its own anchor time and continues incorporating chart volume until midnight in the Europe/Berlin time zone.
Default settings:
VWAP Start time Color
Asia 02:30 Europe/Berlin Turquoise
London/Europe 09:00 Europe/Berlin Yellow
New York 09:30 America/New_York Purple
Daily 00:00 Europe/Berlin Blue
The session start times are adjustable. New York uses its local time zone, automatically accounting for daylight saving time and the weeks when US and European clock changes differ.
These names identify the starting anchors. The calculations continue beyond the corresponding cash-session closing times.
Previous-Day VWAPs
Previous-day VWAPs retain their original anchors and continue incorporating the current day’s volume. They therefore remain dynamic throughout the current day.
Previous-day VWAP Color
Asia Light green
London/Europe Gray
New York Brown
Daily, anchored at 00:00 Black
At each daily rollover, today’s VWAPs become the new previous-day VWAPs, and the older curves disappear. Only the current and previous day’s curves are retained.
For markets without weekend bars, Friday’s VWAPs carry over into Monday and continue incorporating Monday’s volume. On Tuesday, Monday’s VWAPs replace them. This exception applies specifically to Friday–Monday; other holiday gaps are not automatically bridged.
Weekly VWAP
The pink weekly VWAP accumulates valid chart volume from Monday through Friday, using Europe/Berlin calendar boundaries. Only the current week’s curve is displayed. It resets when the first available bar of the new week arrives.
Daily VWAP Extension Bands
Today’s blue daily VWAP includes three pairs of volume-weighted standard deviation bands:
- Orange: +1 and −1 standard deviation.
- Orange: +2 and −2 standard deviations.
- Red: +3 and −3 standard deviations.
The bands reset with the daily VWAP at midnight in Europe/Berlin. Their multipliers, colors, visibility, and line width are adjustable. Bands are calculated only for today’s daily VWAP.
Calculation and Display
All VWAPs use the chart’s own HLC3 price and volume:
VWAP = Σ(HLC3 × Volume) / Σ(Volume)
Each curve has independent accumulators. Missing or invalid data is skipped without substituting artificial volume. Results may differ between symbols and data providers.
Current values for enabled VWAPs and bands are available on the price scale, status line, and Data Window, subject to TradingView’s display settings. Colors, visibility, and line widths can be customized.
Usage Notes
Use standard time-based intraday charts of 1 minute or higher. Sufficient chart history must be loaded to calculate the selected anchors accurately. Bars are assigned by their opening timestamps and are not split across time boundaries.
VWAPs and bands update while the current candle is open. Previous-day curves also change as new current-day volume is added. Older curves are intentionally removed during daily and weekly rollovers.
The indicator provides reference curves for chart analysis. It does not generate buy or sell signals, alerts, or automated trading orders.

免責聲明
這些資訊和出版物並非旨在提供,也不構成TradingView提供或認可的任何形式的財務、投資、交易或其他類型的建議或推薦。請閱讀使用條款以了解更多資訊。
免責聲明
這些資訊和出版物並非旨在提供,也不構成TradingView提供或認可的任何形式的財務、投資、交易或其他類型的建議或推薦。請閱讀使用條款以了解更多資訊。