OPEN-SOURCE SCRIPT
Roy MACD Histogram EMA 5
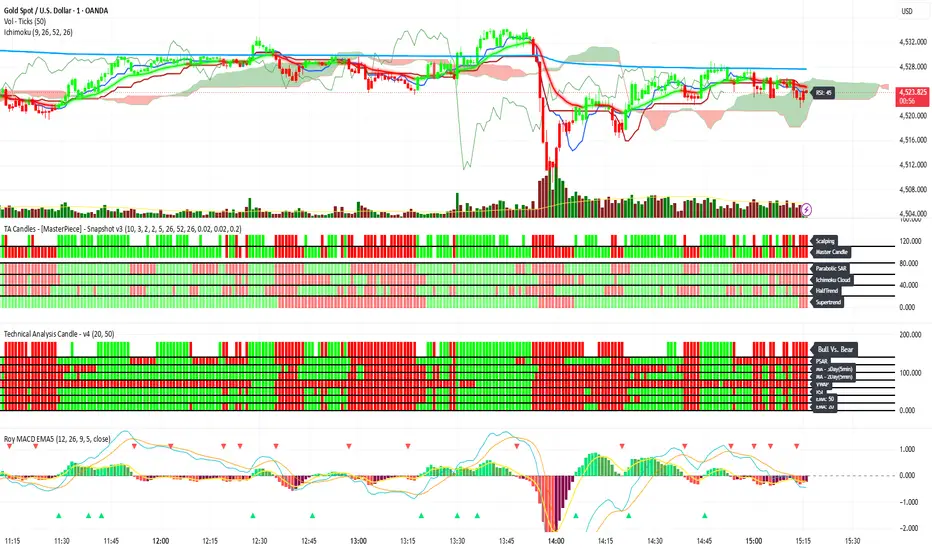
Roy MACD Histogram EMA 5 is a modified MACD momentum indicator with an additional EMA 5 line applied directly to the MACD histogram.
The EMA 5 Histogram helps traders read momentum strength, weakness, and early momentum changes more clearly compared to the standard MACD.
When the histogram is above the EMA 5 Histogram, bullish momentum is considered stronger. When the histogram is below the EMA 5 Histogram, bearish momentum is considered stronger or bullish momentum may be weakening.
This indicator includes MACD Line, Signal Line, Histogram, EMA 5 Histogram, and simple momentum markers to highlight potential bullish or bearish momentum shifts.
Best used together with price action, support and resistance, trendline, market structure, EMA 50/100/200, and proper risk management.
This indicator is not a financial advice or a guaranteed signal system. Always backtest and use proper money management.
The EMA 5 Histogram helps traders read momentum strength, weakness, and early momentum changes more clearly compared to the standard MACD.
When the histogram is above the EMA 5 Histogram, bullish momentum is considered stronger. When the histogram is below the EMA 5 Histogram, bearish momentum is considered stronger or bullish momentum may be weakening.
This indicator includes MACD Line, Signal Line, Histogram, EMA 5 Histogram, and simple momentum markers to highlight potential bullish or bearish momentum shifts.
Best used together with price action, support and resistance, trendline, market structure, EMA 50/100/200, and proper risk management.
This indicator is not a financial advice or a guaranteed signal system. Always backtest and use proper money management.
開源腳本
秉持TradingView一貫精神,這個腳本的創作者將其設為開源,以便交易者檢視並驗證其功能。向作者致敬!您可以免費使用此腳本,但請注意,重新發佈代碼需遵守我們的社群規範。

免責聲明
這些資訊和出版物並非旨在提供,也不構成TradingView提供或認可的任何形式的財務、投資、交易或其他類型的建議或推薦。請閱讀使用條款以了解更多資訊。
免責聲明
這些資訊和出版物並非旨在提供,也不構成TradingView提供或認可的任何形式的財務、投資、交易或其他類型的建議或推薦。請閱讀使用條款以了解更多資訊。