Yearly ROI - Crypto
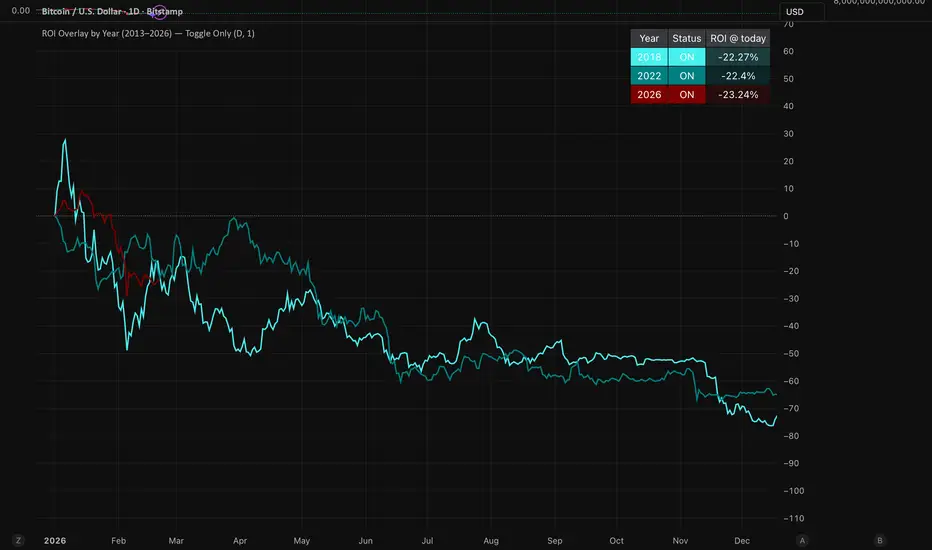
This is a simple script that allows the user to compare different market cycles for any cryptocurrency asset by displaying the yearly ROI for selected years. Although it’s straightforward, it can help you navigate different market conditions by analysing similarities in behaviour at different points in the cycle. Even if you don’t subscribe to cycle theory, it can still be useful for comparing behaviour under similar monetary policy conditions.
The table graphic shows where different years sit relative to the current year. I personally use it to compare mid-term years and historical bear-market years for BTC. As shown in the image above, the current cycle is tracking previous bear-market years closely, and I believe this pattern will continue.
Please let me know if anyone is interested in additional features such as standard deviation and yearly averages, and how they could be used in simple bear-market accumulation strategies.
The table graphic shows where different years sit relative to the current year. I personally use it to compare mid-term years and historical bear-market years for BTC. As shown in the image above, the current cycle is tracking previous bear-market years closely, and I believe this pattern will continue.
Please let me know if anyone is interested in additional features such as standard deviation and yearly averages, and how they could be used in simple bear-market accumulation strategies.

免責聲明
這些資訊和出版物並非旨在提供,也不構成TradingView提供或認可的任何形式的財務、投資、交易或其他類型的建議或推薦。請閱讀使用條款以了解更多資訊。
免責聲明
這些資訊和出版物並非旨在提供,也不構成TradingView提供或認可的任何形式的財務、投資、交易或其他類型的建議或推薦。請閱讀使用條款以了解更多資訊。