M-Alpha-Wall - High Volume Price Levels
What it does
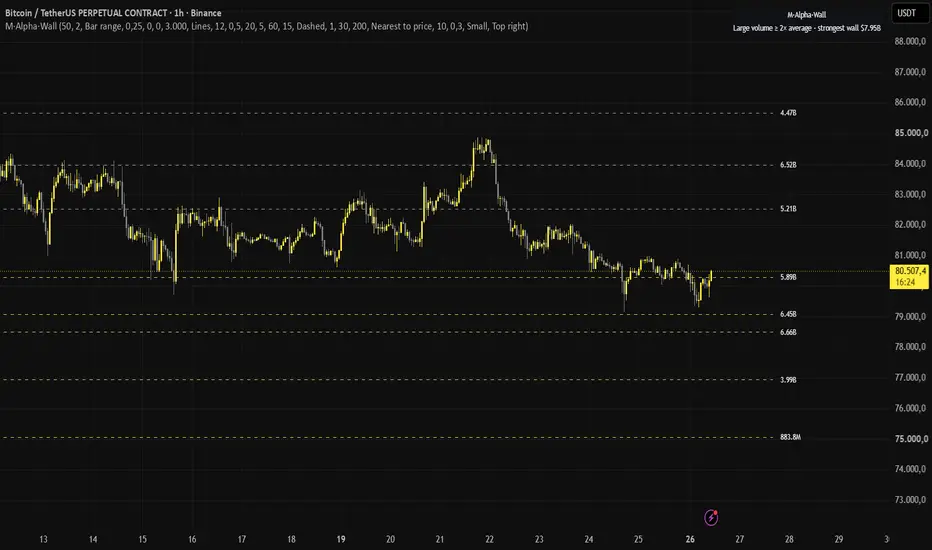
M-Alpha-Wall marks price levels where unusually large volume changed hands ("walls"). Walls below the current price are shown as support (yellow), walls above as resistance (grey). The stronger a wall, the more dollar volume was traded at that level during high-volume bars. Amounts are labelled next to the walls closest to the current price.
How it works
1. Large-volume bars: on every confirmed bar the volume is compared with its simple moving average (default 50 bars). Only bars with at least x times the average volume (default 2x) are used.
2. Placing the volume: the dollar volume of such a bar (volume x hlc3) is either spread evenly over the bar's range from low to high, or put on one level at the bar's typical price (selectable).
3. Levels: the amounts are accumulated into price buckets of a fixed percentage width on a logarithmic grid, so walls stay comparable across price levels.
4. Peaks: optionally only the strongest level within a neighbourhood (default +/- 0.5 % of price) is shown, which turns a wide cluster into one clear wall.
5. Ageing: walls can fade out with a decay per bar and can be dropped after a maximum age (both off by default).
6. Display: the strongest walls per side are drawn, plus the walls nearest to the current price, which always remain visible. Optionally, stronger walls get thicker lines. Labels close to each other are merged into one.
How to use it
- Works on any symbol and timeframe that provides volume.
- Read the walls as areas where a lot of trading took place and where price may react again, not as buy or sell signals.
- Raise "Large volume = at least x times average" for fewer, more significant walls; lower it for more detail.
- Use decay or a maximum age if you only want recent walls.
- Display options: lines, clouds or both.
What makes it different
- Only high-volume bars build walls, so ordinary trading does not blur the picture the way a full volume profile can.
- The peak filter shows one wall per area instead of a block of neighbouring levels.
- Walls nearest to price stay visible next to the strongest ones, with merged amount labels, which keeps the chart readable on long histories.
- Calculations run on confirmed bars only; nothing is drawn from future data.
Limitations
- Bar volume does not show at which exact price inside the bar the trades happened; spreading it over the bar range is an approximation.
- Volume differs between exchanges and data feeds; the walls reflect the volume of the chart's symbol only.
- Past trading activity does not guarantee a reaction at the same level in the future.
- The script does not generate signals and makes no statement about future price movement. Use it as context together with your own analysis.
M-Alpha-Wall marks price levels where unusually large volume changed hands ("walls"). Walls below the current price are shown as support (yellow), walls above as resistance (grey). The stronger a wall, the more dollar volume was traded at that level during high-volume bars. Amounts are labelled next to the walls closest to the current price.
How it works
1. Large-volume bars: on every confirmed bar the volume is compared with its simple moving average (default 50 bars). Only bars with at least x times the average volume (default 2x) are used.
2. Placing the volume: the dollar volume of such a bar (volume x hlc3) is either spread evenly over the bar's range from low to high, or put on one level at the bar's typical price (selectable).
3. Levels: the amounts are accumulated into price buckets of a fixed percentage width on a logarithmic grid, so walls stay comparable across price levels.
4. Peaks: optionally only the strongest level within a neighbourhood (default +/- 0.5 % of price) is shown, which turns a wide cluster into one clear wall.
5. Ageing: walls can fade out with a decay per bar and can be dropped after a maximum age (both off by default).
6. Display: the strongest walls per side are drawn, plus the walls nearest to the current price, which always remain visible. Optionally, stronger walls get thicker lines. Labels close to each other are merged into one.
How to use it
- Works on any symbol and timeframe that provides volume.
- Read the walls as areas where a lot of trading took place and where price may react again, not as buy or sell signals.
- Raise "Large volume = at least x times average" for fewer, more significant walls; lower it for more detail.
- Use decay or a maximum age if you only want recent walls.
- Display options: lines, clouds or both.
What makes it different
- Only high-volume bars build walls, so ordinary trading does not blur the picture the way a full volume profile can.
- The peak filter shows one wall per area instead of a block of neighbouring levels.
- Walls nearest to price stay visible next to the strongest ones, with merged amount labels, which keeps the chart readable on long histories.
- Calculations run on confirmed bars only; nothing is drawn from future data.
Limitations
- Bar volume does not show at which exact price inside the bar the trades happened; spreading it over the bar range is an approximation.
- Volume differs between exchanges and data feeds; the walls reflect the volume of the chart's symbol only.
- Past trading activity does not guarantee a reaction at the same level in the future.
- The script does not generate signals and makes no statement about future price movement. Use it as context together with your own analysis.

Tested on unseen data, honest weekly results, no promises. malphacore.com · Shop: t.me/MAlphaCoreShopBot?start=tv
免責聲明
這些資訊和出版物並非旨在提供,也不構成TradingView提供或認可的任何形式的財務、投資、交易或其他類型的建議或推薦。請閱讀使用條款以了解更多資訊。
Tested on unseen data, honest weekly results, no promises. malphacore.com · Shop: t.me/MAlphaCoreShopBot?start=tv
免責聲明
這些資訊和出版物並非旨在提供,也不構成TradingView提供或認可的任何形式的財務、投資、交易或其他類型的建議或推薦。請閱讀使用條款以了解更多資訊。