OPEN-SOURCE SCRIPT
FishBands H TheurgyLabs
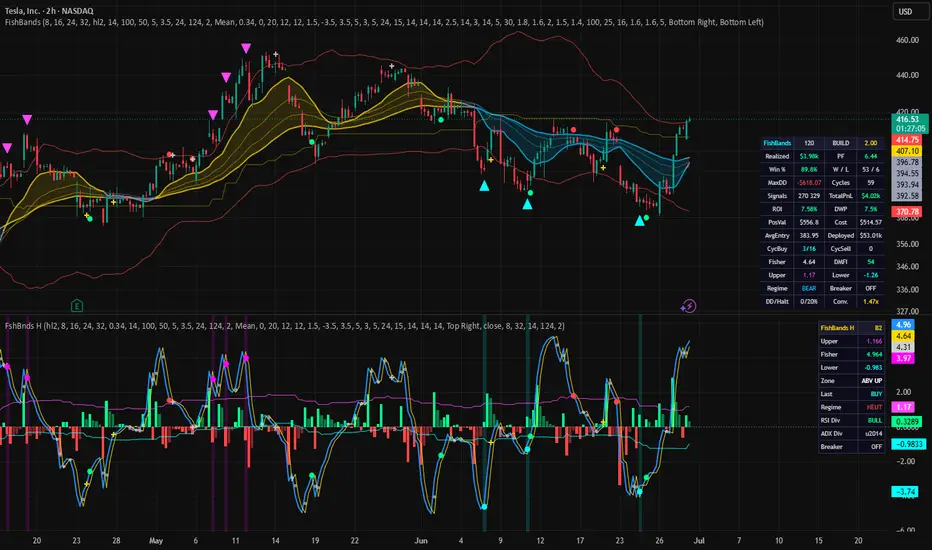
FishBands H is the companion oscillator for the FishBands overlay. It renders the Fisher Transform mechanism in a separate pane — the histogram, the Fisher and Trigger lines, the learned adaptive thresholds, and the turn dots that show exactly where each signal decision happens. The signal chain is byte-identical to the overlay: same inputs, same logic, same fires.
Pair with the FishBands overlay to see both the price-level view (ribbon, bands, triangles) and the oscillator-level view (Fisher extremes, threshold crossings, momentum state) simultaneously.
## What It Shows
The Fisher histogram (Fisher minus Trigger) uses 4-state momentum coloring. Bright green means the histogram is positive and accelerating. Dim green means positive but decelerating. Bright red means negative and accelerating. Dim red means negative but decelerating. This shows the direction and intensity of Fisher momentum at a glance.
The Fisher line (blue) is the Ehlers Fisher Transform computed on ATR-normalized spread from the overlay's SMMA ribbon. The Trigger line (gold) is the prior bar's Fisher value — turns are detected when the Fisher changes direction relative to the Trigger.
The upper threshold (magenta) is the rolling mean of Fisher peak levels over a 124-bar lookback window. The lower threshold (cyan) is the mean of valley levels. A buy fires when the Fisher turns up and the crossover level (midpoint of Fisher and Trigger) is below the lower threshold. A sell fires when the Fisher turns down and the crossover level is above the upper threshold.
## Turn Dots
Every Fisher turn is logged as a dim gray dot at the crossLevel. Turns that pass all gates and fire as actual signals are plotted as bright dots — cyan for buys, magenta for sells. This makes it easy to see which turns were deep enough to qualify and which were filtered out. Most turns are dim (logged only); the bright ones are the signals the overlay fires.
## Divergence Marks
RSI divergence confirmations appear as green circles (bull, price lower-low with RSI higher-low) and red circles (bear, price higher-high with RSI lower-high). ADX divergence confirmations appear as gold crosses (bull, price lower-low with fading trend strength) and silver crosses (bear, price higher-high with fading trend strength). These are the same marks shown on the overlay — they appear at the Fisher line level in the oscillator pane for easy correlation with the Fisher state at the time of confirmation.
## SpreadZ Line
The SpreadZ line (regime-colored, scaled 10x for visibility) shows the z-scored ATR-normalized ribbon spread — the same computation used by the SpreadZ Override in the signal chain. Zero-cross diamonds mark when spreadZ crosses its zero line (cyan = cross up, magenta = cross down). Both the line and diamonds default OFF and can be toggled in the SpreadZ input group.
## Band Filter
The companion replicates the overlay's full Donchian penetration-learning band computation. Donchian Length, Penetration Learning, Pen Learn Bars, Band Smoothing, and ATR Mult inputs match the overlay's ATR/Bands group. The Band Filter toggle and Band Offset (ATR) match the overlay's Band Filter group. When enabled, the filter requires price near the learned bands for a signal to fire — identical to the overlay's behavior.
## Gate Stack
Every gate from the overlay is replicated with matching defaults. Regime Gate (ON), Band Filter (ON), LL/HH Filter (OFF), Tail-Risk Breaker (OFF), Regime Maturity Gate (OFF), SpreadZ Override Buy/Sell (OFF). The breaker uses a minimal flat-dollar position replay to compute drawdown — it does not carry a full performance table.
## Status Table
The table (default Top Right) shows the current Fisher value, upper and lower thresholds, zone (ABV UP / UP MID / LOW MID / BLW LOW), last signal (BUY/SELL), regime (BULL/BEAR/NEUT), RSI divergence state, ADX divergence state, and breaker status.
## Settings Sync
For the overlay and companion to show identical signals, keep Ribbon, ATR, Fisher, Regime Gate, LL/HH, Band Filter, Risk, Maturity Gate, Z-Override, and Divergence inputs matched between the two indicators. The companion does not replicate conviction sizing or the performance table — these are overlay-only and do not affect signal timing.
TheurgyLabs — Conjured with AI.
開源腳本
秉持TradingView一貫精神,這個腳本的創作者將其設為開源,以便交易者檢視並驗證其功能。向作者致敬!您可以免費使用此腳本,但請注意,重新發佈代碼需遵守我們的社群規範。

免責聲明
這些資訊和出版物並非旨在提供,也不構成TradingView提供或認可的任何形式的財務、投資、交易或其他類型的建議或推薦。請閱讀使用條款以了解更多資訊。
開源腳本
秉持TradingView一貫精神,這個腳本的創作者將其設為開源,以便交易者檢視並驗證其功能。向作者致敬!您可以免費使用此腳本,但請注意,重新發佈代碼需遵守我們的社群規範。
免責聲明
這些資訊和出版物並非旨在提供,也不構成TradingView提供或認可的任何形式的財務、投資、交易或其他類型的建議或推薦。請閱讀使用條款以了解更多資訊。