OPEN-SOURCE SCRIPT
已更新 OBV Trend Candles
OBV Trend Candles
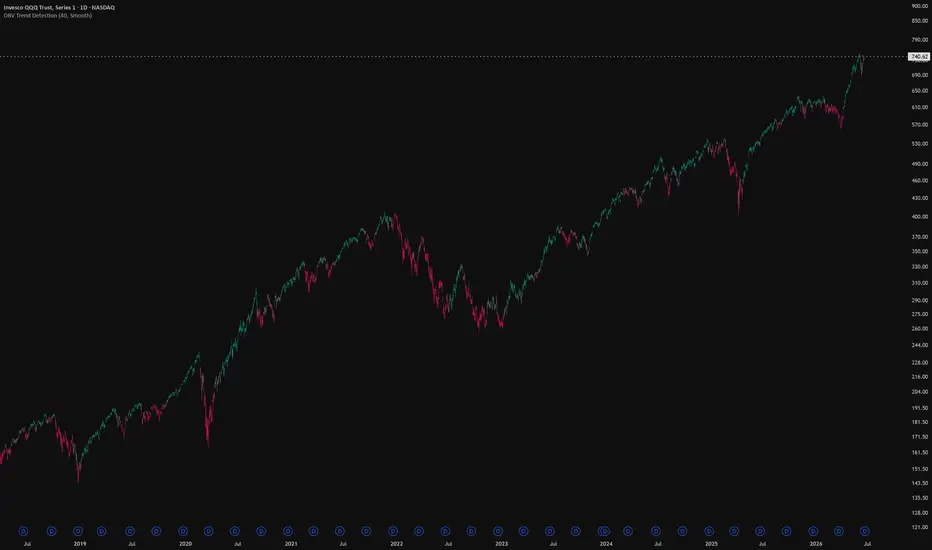
This indicator colors your candles based on the relationship between On-Balance Volume (OBV) and a moving average of OBV. It's a simple way to keep volume-based trend context visible directly on the price chart, without having to watch a separate OBV pane.
How it works
OBV accumulates volume on up-closes and subtracts it on down-closes, so a rising OBV means volume is flowing into the asset and a falling OBV means it's flowing out. This script takes that OBV line and compares it to a simple moving average of itself:
When OBV is above its SMA, volume momentum is building → candles are painted green.
When OBV is below its SMA, volume momentum is fading → candles are painted red.
The idea is that volume often shifts before or alongside price, so the color flips can give you a read on whether the current move is backed by participation.
The Sensitivity input
The single setting that matters is Sensitivity, which is the length of the SMA applied to OBV. Lower values make the indicator react faster to changes in volume flow (more color flips, more noise), while higher values smooth things out and only flip on more established shifts. Tune it to your timeframe and trading style — there's no universally "correct" value.
Notes
It works on any timeframe and any asset, as long as that asset reports volume data. On symbols without volume (some forex pairs and certain indices), OBV can't be calculated and the script will let you know. Colors are fully customizable in the settings.
This is a context/confirmation tool, not a standalone signal — it tells you about volume flow, not where to enter or exit. Use it alongside your own analysis.
This indicator colors your candles based on the relationship between On-Balance Volume (OBV) and a moving average of OBV. It's a simple way to keep volume-based trend context visible directly on the price chart, without having to watch a separate OBV pane.
How it works
OBV accumulates volume on up-closes and subtracts it on down-closes, so a rising OBV means volume is flowing into the asset and a falling OBV means it's flowing out. This script takes that OBV line and compares it to a simple moving average of itself:
When OBV is above its SMA, volume momentum is building → candles are painted green.
When OBV is below its SMA, volume momentum is fading → candles are painted red.
The idea is that volume often shifts before or alongside price, so the color flips can give you a read on whether the current move is backed by participation.
The Sensitivity input
The single setting that matters is Sensitivity, which is the length of the SMA applied to OBV. Lower values make the indicator react faster to changes in volume flow (more color flips, more noise), while higher values smooth things out and only flip on more established shifts. Tune it to your timeframe and trading style — there's no universally "correct" value.
Notes
It works on any timeframe and any asset, as long as that asset reports volume data. On symbols without volume (some forex pairs and certain indices), OBV can't be calculated and the script will let you know. Colors are fully customizable in the settings.
This is a context/confirmation tool, not a standalone signal — it tells you about volume flow, not where to enter or exit. Use it alongside your own analysis.
發行說明
Adding a color flip transition selector.發行說明
Small display adjustment發行說明
Changed the indicator names to OBV Trend Detection開源腳本
秉持TradingView一貫精神,這個腳本的創作者將其設為開源,以便交易者檢視並驗證其功能。向作者致敬!您可以免費使用此腳本,但請注意,重新發佈代碼需遵守我們的社群規範。

atreidis.app/ Know what regime Bitcoin is in, daily.
Built by a Bitcoiner who got tired of riding the chart down 70%+ every cycle. One dashboard. One color-coded signal. Read the market at a glance.
Built by a Bitcoiner who got tired of riding the chart down 70%+ every cycle. One dashboard. One color-coded signal. Read the market at a glance.
免責聲明
這些資訊和出版物並非旨在提供,也不構成TradingView提供或認可的任何形式的財務、投資、交易或其他類型的建議或推薦。請閱讀使用條款以了解更多資訊。
開源腳本
秉持TradingView一貫精神,這個腳本的創作者將其設為開源,以便交易者檢視並驗證其功能。向作者致敬!您可以免費使用此腳本,但請注意,重新發佈代碼需遵守我們的社群規範。
atreidis.app/ Know what regime Bitcoin is in, daily.
Built by a Bitcoiner who got tired of riding the chart down 70%+ every cycle. One dashboard. One color-coded signal. Read the market at a glance.
Built by a Bitcoiner who got tired of riding the chart down 70%+ every cycle. One dashboard. One color-coded signal. Read the market at a glance.
免責聲明
這些資訊和出版物並非旨在提供,也不構成TradingView提供或認可的任何形式的財務、投資、交易或其他類型的建議或推薦。請閱讀使用條款以了解更多資訊。