Midas Liquidity Heatmap
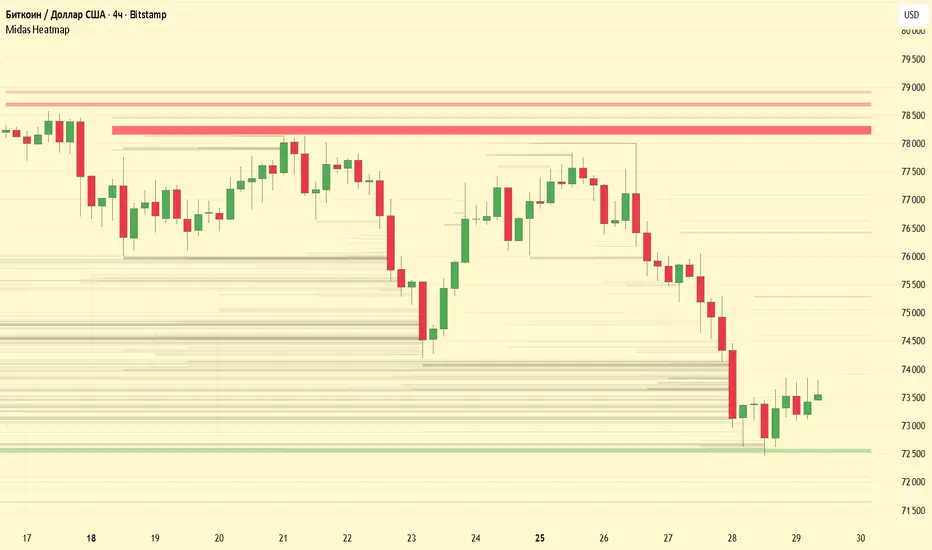
Midas Liquidity Heatmap
Overview
Midas Liquidity Heatmap is a multi-source liquidity zone indicator for cryptocurrency markets. It is designed to highlight potential liquidity areas above and below the current price by analyzing price action, volume behavior and source confluence.
The script runs a liquidity engine across four fixed market sources: Binance Spot, Binance Futures, Bybit Spot and Bybit Futures. These sources are aggregated into one heatmap, and a zone is displayed only when enough sources point to a similar price area. This helps reduce single-exchange noise and makes the displayed zones less dependent on the currently selected chart exchange.
This indicator is designed for tradable crypto spot and futures pairs. It is intentionally disabled on index and dominance charts, such as BTC.D, ETH.D, USDT.D, USDC.D, TOTAL, TOTAL2, TOTAL3 and similar symbols, because these charts do not represent directly tradable order-flow markets for a single asset.
How it works
Each source is processed separately. Volume is accumulated and normalized per source, so one venue does not dominate the final heatmap only because it has higher reported volume. If volume data is not available, candle range is used as a fallback proxy.
A shared calculation range is built from all active sources before zones are created. This keeps all sources aligned inside the same internal price grid.
Each price area tracks which sources contributed to it. A zone is drawn only when the required number of sources agrees around a similar price area. A small neighboring-range tolerance is used to handle minor price differences between exchanges.
When price trades through a level, that level is treated as swept liquidity. Swept levels are shown as faint history lines, so users can see where price has already interacted with previous liquidity areas.
The script also strengthens zones located near important swing highs and swing lows. In addition, an independent volume-swing module detects high-volume swing points and adds extra weight to the same heatmap engine. This module uses custom pivot detection, width calculation, strength scoring and engine-grid alignment.
If fewer than two external sources are available for a symbol, the script automatically falls back to the current chart data.
How to use
Red zones represent potential liquidity above price.
Green zones represent potential liquidity below price.
Brighter or wider zones indicate stronger estimated liquidity.
Faint neutral lines show levels that have already been swept by price.
The zones can be used as market context: possible reaction areas, liquidity targets, or places where stop orders may cluster. They should be combined with market structure, trend, volume analysis and proper risk management.
Credits and License
This script is based on the open-source “Dynamic Liquidity HeatMap Profile [BigBeluga]” by BigBeluga, licensed under Mozilla Public License 2.0.
The original source link is included in the script header.
This version extends the original concept with multi-source exchange aggregation, cross-exchange confluence filtering, per-source normalization, chart fallback logic, swept-liquidity history, important-extremes weighting and an independently implemented volume-swing boost module.
Important note
Midas Liquidity Heatmap does not use real exchange liquidation data or live order-book data. It models potential liquidity areas using price action, volume behavior and cross-source confluence.
This indicator is for informational and educational purposes only. It is not a standalone buy or sell signal and is not financial advice.
Overview
Midas Liquidity Heatmap is a multi-source liquidity zone indicator for cryptocurrency markets. It is designed to highlight potential liquidity areas above and below the current price by analyzing price action, volume behavior and source confluence.
The script runs a liquidity engine across four fixed market sources: Binance Spot, Binance Futures, Bybit Spot and Bybit Futures. These sources are aggregated into one heatmap, and a zone is displayed only when enough sources point to a similar price area. This helps reduce single-exchange noise and makes the displayed zones less dependent on the currently selected chart exchange.
This indicator is designed for tradable crypto spot and futures pairs. It is intentionally disabled on index and dominance charts, such as BTC.D, ETH.D, USDT.D, USDC.D, TOTAL, TOTAL2, TOTAL3 and similar symbols, because these charts do not represent directly tradable order-flow markets for a single asset.
How it works
Each source is processed separately. Volume is accumulated and normalized per source, so one venue does not dominate the final heatmap only because it has higher reported volume. If volume data is not available, candle range is used as a fallback proxy.
A shared calculation range is built from all active sources before zones are created. This keeps all sources aligned inside the same internal price grid.
Each price area tracks which sources contributed to it. A zone is drawn only when the required number of sources agrees around a similar price area. A small neighboring-range tolerance is used to handle minor price differences between exchanges.
When price trades through a level, that level is treated as swept liquidity. Swept levels are shown as faint history lines, so users can see where price has already interacted with previous liquidity areas.
The script also strengthens zones located near important swing highs and swing lows. In addition, an independent volume-swing module detects high-volume swing points and adds extra weight to the same heatmap engine. This module uses custom pivot detection, width calculation, strength scoring and engine-grid alignment.
If fewer than two external sources are available for a symbol, the script automatically falls back to the current chart data.
How to use
Red zones represent potential liquidity above price.
Green zones represent potential liquidity below price.
Brighter or wider zones indicate stronger estimated liquidity.
Faint neutral lines show levels that have already been swept by price.
The zones can be used as market context: possible reaction areas, liquidity targets, or places where stop orders may cluster. They should be combined with market structure, trend, volume analysis and proper risk management.
Credits and License
This script is based on the open-source “Dynamic Liquidity HeatMap Profile [BigBeluga]” by BigBeluga, licensed under Mozilla Public License 2.0.
The original source link is included in the script header.
This version extends the original concept with multi-source exchange aggregation, cross-exchange confluence filtering, per-source normalization, chart fallback logic, swept-liquidity history, important-extremes weighting and an independently implemented volume-swing boost module.
Important note
Midas Liquidity Heatmap does not use real exchange liquidation data or live order-book data. It models potential liquidity areas using price action, volume behavior and cross-source confluence.
This indicator is for informational and educational purposes only. It is not a standalone buy or sell signal and is not financial advice.

Telegram: t.me/+0cRmtIoj1QU5ZWE6
YouTube: youtube.com/@midas_ecosystem
Биржа WEEX: weex.com/ru/register?vipCode=weexmidas
Биржа BingX: bingx.com/partner/MidasCapital
YouTube: youtube.com/@midas_ecosystem
Биржа WEEX: weex.com/ru/register?vipCode=weexmidas
Биржа BingX: bingx.com/partner/MidasCapital
免責聲明
這些資訊和出版物並非旨在提供,也不構成TradingView提供或認可的任何形式的財務、投資、交易或其他類型的建議或推薦。請閱讀使用條款以了解更多資訊。
Telegram: t.me/+0cRmtIoj1QU5ZWE6
YouTube: youtube.com/@midas_ecosystem
Биржа WEEX: weex.com/ru/register?vipCode=weexmidas
Биржа BingX: bingx.com/partner/MidasCapital
YouTube: youtube.com/@midas_ecosystem
Биржа WEEX: weex.com/ru/register?vipCode=weexmidas
Биржа BingX: bingx.com/partner/MidasCapital
免責聲明
這些資訊和出版物並非旨在提供,也不構成TradingView提供或認可的任何形式的財務、投資、交易或其他類型的建議或推薦。請閱讀使用條款以了解更多資訊。