已更新
Midnight Open Suite+ (M1D)
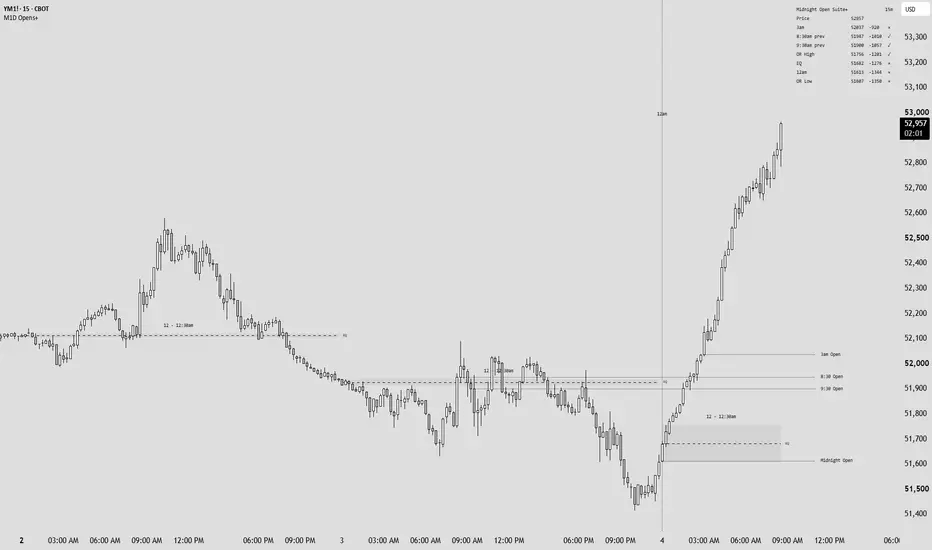
Midnight Open — is ICT's primary intraday bias reference.
Price trading above it is at a premium to that open; price trading below it is at a discount. It is a level the market returns to often enough that where price sits relative to it is worth knowing before anything else about the day.
This script marks that open and the three that follow it, measures the range the first half hour builds, and reports where price stands against each. It takes no directional opinion of its own.
THE OPENS
Four New York opens are drawn, each on its own settings:
- 12am, the Midnight Open.
- 3am, the London open.
- 8:30am, the release time that begins the New York morning.
- 9:30am, the cash open.
Each is a ray beginning at the candle that genuinely opened on its own time, carrying that candle's opening price. No level is drawn back across bars that closed before the price it marks existed, and no price is borrowed from a neighbouring bar.
Each open also carries an optional vertical line marking the minute itself, stamped with its own time. That stamp is derived from the time the open is configured to, so it cannot drift out of agreement with the level it names — move an open to a different minute and its stamp moves with it.
By default a level stops where the following day's level begins, so only one of each is ever live. It can instead be set to run on indefinitely.
THE OPENING RANGE
The 12:00–12:30am window is drawn as a single zone from its own high to its own low, with an optional equilibrium — the 50% — running across it. The window opens on the Midnight Open's own time and its length is adjustable, so moving the open moves the range with it.
The 50% of a range is its equilibrium.
Zone and equilibrium are both kept for several days. Four days is the default, which leaves the previous three equilibria on the chart behind the current one.
WHY A LEVEL IS SOMETIMES WITHHELD
An open can only be read from a bar that opens on that exact minute. A bar that merely contains the minute opened earlier and carries an earlier price. On a 60-minute chart there is no bar that opens at 8:30 or at 9:30, so those two are not drawn at all rather than being placed a few points out — a level that is slightly wrong still looks right, which makes it worse than one that is visibly absent.
Withheld levels are never silent. The dashboard names each one and states the bar size that dropped it, so an empty row reads as "this timeframe cannot measure it" rather than "it has not happened yet".
An open is placeable when the chart's bar length divides evenly into the minutes between midnight and that open. With the four default times and the half-hour range, that means any bar length dividing 30 minutes — the 1, 2, 3, 5, 10, 15 and 30 minute charts. Move an open to a different minute and the arithmetic follows it.
THE DASHBOARD
Bias is read from the Midnight Open alone, and is stated as both a direction and the premium or discount it implies.
Below it each open is listed with its price and the signed distance price currently sits from it, in points or in ticks. The opening range is listed with its size and whether price stands above, inside or below it, and the equilibrium with its own price and distance.
A level carried in from a previous day is still the level drawn on the chart, so it is still listed — but it is named as carried over, because reading a stale open as today's is how it gets traded by mistake.
WHAT IT DRAWS
- Four opens as dotted rays, each from the candle that set it, named above its own line.
- An optional full-height vertical line on each open, stamped with its time.
- The 12:00–12:30am range as a soft zone whose border matches its fill, captioned with the window it covers. The caption re-centres on the span the zone currently occupies, so it tracks across with it rather than trailing at the left edge.
- The equilibrium as a thin dashed line through the zone, named inline on its own level so the text sits exactly at the price.
- Optional rays extending the range's high and low.
- A dashboard carrying bias, every open with its distance, and the range with its position.
Labels are transparent callouts throughout: nothing carries a background, and every offset is in pixels rather than price, so the spacing holds at any zoom level.
SETTINGS
- Each open has its own show toggle, name, hour and minute, ray colour, style and width, and the same four controls again for its vertical line and time stamp.
- How many days of levels stay on the chart, and whether a ray stops at the next day's level or runs to the right edge.
- Opening range: window length, zone colour and transparency, how far the zone extends, whether the high and low extend as rays, and the zone's caption.
- Equilibrium: visibility, colour, line style, and whether it is named.
- Labels: whether levels are named, whether the price is included in the name, whether every kept day is named or only the newest, time stamp position, and label size.
- Dashboard: position, text and background colours, header fill, the two directional colours, text size, and whether distance is reported in points or ticks.
NOTES
- Non-repainting. Levels are set on confirmed bars only and none is revised once its bar has closed.
- All times are New York and resolve through the exchange-independent New York clock, so they stay correct across daylight saving on any symbol.
- At the default times every level is measurable on the 1, 2, 3, 5, 10, 15 and 30 minute charts. Any other timeframe drops whichever levels its bars cannot open on, and names them.
- Four alert conditions: price crossing the Midnight Open, price crossing the opening range equilibrium, and the range's high or low being closed through.
- Every drawn element is black by default. Only the dashboard's directional readings carry colour, and all of them are inputs.
- This is a mapping tool. It draws reference levels and reports where price sits relative to them; it produces no entries, targets or stops.
Disclaimer-
This is not financial advice. A level drawn by a model is context, not a recommendation to trade, and where price opened yesterday says nothing certain about where it goes today.
Price trading above it is at a premium to that open; price trading below it is at a discount. It is a level the market returns to often enough that where price sits relative to it is worth knowing before anything else about the day.
This script marks that open and the three that follow it, measures the range the first half hour builds, and reports where price stands against each. It takes no directional opinion of its own.
THE OPENS
Four New York opens are drawn, each on its own settings:
- 12am, the Midnight Open.
- 3am, the London open.
- 8:30am, the release time that begins the New York morning.
- 9:30am, the cash open.
Each is a ray beginning at the candle that genuinely opened on its own time, carrying that candle's opening price. No level is drawn back across bars that closed before the price it marks existed, and no price is borrowed from a neighbouring bar.
Each open also carries an optional vertical line marking the minute itself, stamped with its own time. That stamp is derived from the time the open is configured to, so it cannot drift out of agreement with the level it names — move an open to a different minute and its stamp moves with it.
By default a level stops where the following day's level begins, so only one of each is ever live. It can instead be set to run on indefinitely.
THE OPENING RANGE
The 12:00–12:30am window is drawn as a single zone from its own high to its own low, with an optional equilibrium — the 50% — running across it. The window opens on the Midnight Open's own time and its length is adjustable, so moving the open moves the range with it.
The 50% of a range is its equilibrium.
Zone and equilibrium are both kept for several days. Four days is the default, which leaves the previous three equilibria on the chart behind the current one.
WHY A LEVEL IS SOMETIMES WITHHELD
An open can only be read from a bar that opens on that exact minute. A bar that merely contains the minute opened earlier and carries an earlier price. On a 60-minute chart there is no bar that opens at 8:30 or at 9:30, so those two are not drawn at all rather than being placed a few points out — a level that is slightly wrong still looks right, which makes it worse than one that is visibly absent.
Withheld levels are never silent. The dashboard names each one and states the bar size that dropped it, so an empty row reads as "this timeframe cannot measure it" rather than "it has not happened yet".
An open is placeable when the chart's bar length divides evenly into the minutes between midnight and that open. With the four default times and the half-hour range, that means any bar length dividing 30 minutes — the 1, 2, 3, 5, 10, 15 and 30 minute charts. Move an open to a different minute and the arithmetic follows it.
THE DASHBOARD
Bias is read from the Midnight Open alone, and is stated as both a direction and the premium or discount it implies.
Below it each open is listed with its price and the signed distance price currently sits from it, in points or in ticks. The opening range is listed with its size and whether price stands above, inside or below it, and the equilibrium with its own price and distance.
A level carried in from a previous day is still the level drawn on the chart, so it is still listed — but it is named as carried over, because reading a stale open as today's is how it gets traded by mistake.
WHAT IT DRAWS
- Four opens as dotted rays, each from the candle that set it, named above its own line.
- An optional full-height vertical line on each open, stamped with its time.
- The 12:00–12:30am range as a soft zone whose border matches its fill, captioned with the window it covers. The caption re-centres on the span the zone currently occupies, so it tracks across with it rather than trailing at the left edge.
- The equilibrium as a thin dashed line through the zone, named inline on its own level so the text sits exactly at the price.
- Optional rays extending the range's high and low.
- A dashboard carrying bias, every open with its distance, and the range with its position.
Labels are transparent callouts throughout: nothing carries a background, and every offset is in pixels rather than price, so the spacing holds at any zoom level.
SETTINGS
- Each open has its own show toggle, name, hour and minute, ray colour, style and width, and the same four controls again for its vertical line and time stamp.
- How many days of levels stay on the chart, and whether a ray stops at the next day's level or runs to the right edge.
- Opening range: window length, zone colour and transparency, how far the zone extends, whether the high and low extend as rays, and the zone's caption.
- Equilibrium: visibility, colour, line style, and whether it is named.
- Labels: whether levels are named, whether the price is included in the name, whether every kept day is named or only the newest, time stamp position, and label size.
- Dashboard: position, text and background colours, header fill, the two directional colours, text size, and whether distance is reported in points or ticks.
NOTES
- Non-repainting. Levels are set on confirmed bars only and none is revised once its bar has closed.
- All times are New York and resolve through the exchange-independent New York clock, so they stay correct across daylight saving on any symbol.
- At the default times every level is measurable on the 1, 2, 3, 5, 10, 15 and 30 minute charts. Any other timeframe drops whichever levels its bars cannot open on, and names them.
- Four alert conditions: price crossing the Midnight Open, price crossing the opening range equilibrium, and the range's high or low being closed through.
- Every drawn element is black by default. Only the dashboard's directional readings carry colour, and all of them are inputs.
- This is a mapping tool. It draws reference levels and reports where price sits relative to them; it produces no entries, targets or stops.
Disclaimer-
This is not financial advice. A level drawn by a model is context, not a recommendation to trade, and where price opened yesterday says nothing certain about where it goes today.
發行說明
Level names sit right of the line. Each open's name is now placed at the right end of its ray, centred on the price it names and reading to the right — the same placement every other level tool uses, so the four opens read the same way as everything else on the chart. A new setting, Label placement, carries it; the previous treatment, the name sitting on top of the ray's end, is one option away. A second new setting, Right offset (bars), sets the runway between the live candle and the end of the newest ray, which is where its name sits.
Yesterday's opens leave when today's arrive. Days kept is now two settings. Days of opens kept defaults to one: when the next day's open prints, the previous day's ray and its name are removed together, so the right edge carries one line per open and nothing is left dangling. Days of ranges kept stays at four, so the prior opening-range equilibria remain as forward reference. Name levels for now defaults to Newest day only for the same reason; Every day kept is still there.
The dashboard reads as a verdict.
White cells, black ink, no header band, and one coloured line only: the verdict, which says in words whether price is at a premium or a discount to the Midnight Open. Under it, the nearest drawn level above and below price with its distance, then the levels, the range and its equilibrium. Every cell carries its own arithmetic in a tooltip — hover a distance and it shows the close, the level and the subtraction. A row with nothing to say yet, such as an open that has not printed, is left out rather than shown as a dash. A new Grid lines setting draws the cell borders that separate the names on the left from the prices and distances on the right.
Standard deviations of the opening range.
A new group, off by default. The 12:00 to 12:30 range's own height, wick to wick, is projected above its high and below its low and named by its count alone: -1, -2, -3, -4, up to six. The upward set is named at the right end and the downward set at the left, so the two never share a column, and the ladder extends with the zone. Days of projections kept defaults to one, so yesterday's ladder is removed the moment today's range completes while the range and equilibrium themselves stay; set it higher to keep earlier ladders, with the note that one day's ladder ends where the next begins, so kept ladders meet at every day boundary.
Every default not named above is as it was, and nothing changes in how the opens, the range or the equilibrium are found.
發行說明
A fifth open, on its own clockA new 5th Open group, off by default, adds one more open with its own time and its own clock. It defaults to 00:00 UTC, the UTC day boundary: 20:00 New York during US daylight time and 19:00 in winter, followed automatically so the level never drifts when the clocks change. Set the clock to New York to place it on any New York time instead. Its name, ray, vertical and time tag take the same settings as the other four.
Evening opens belong to the next day
Any open that prints at 18:00 New York or later now counts toward the trading day that follows it, not the evening it prints on. It is no longer marked as carried over through the session it actually frames. From 18:00 onward the day's earlier opens read as the previous day's, in line with the futures session.
A minimal table
The dashboard is now a minimal panel: the script's name, the instrument and the timeframe, then every drawn open, the opening range high and low and its equilibrium, from highest to lowest, with price slotted in where it sits. Each row shows the level's price and its distance from the last close, signed + above price and - below, with a tick once price has traded back through it since it printed and a cross while it has not. Hover a row for the arithmetic and the time it was traded. No fill and no grid lines, one frame; the verdict line and its two colours have gone, and one Text and frame colour remains.
Dark charts
A new Chart theme setting under General. On Dark, every black line, name and time tag turns light, the opening range zone lightens with it, and the table's text and frame turn light, so nothing disappears into a dark background. Colours you have set that are not black are left as they are.
Every default not named above is as it was, and nothing changes in how the opens, the range or the equilibrium are found.
發行說明
90 minute charts named correctlyOn a 90 minute chart the timeframe tag read 1H. It now reads 90m. Every other timeframe already read correctly. The midnight open, ranges and settings are unchanged.
發行說明
Clean look: the opening range zone is grey, fill only, with no border.The table has no frame, the title row carries the chart timeframe, and the rows are in sentence case.
Opens and levels unchanged.

免責聲明
這些資訊和出版物並非旨在提供,也不構成TradingView提供或認可的任何形式的財務、投資、交易或其他類型的建議或推薦。請閱讀使用條款以了解更多資訊。