SPY Bear Regime Short System
SPY Bear Regime Short System
A rules-based short-selling strategy designed to profit during bear market regimes. Backtested on SPY daily data from 1994 to 2025 using Wealth-Lab 8.
The system identifies weak counter-trend bounces within established downtrends and shorts them with mechanical entry and exit rules. No discretion, no optimization — just objective conditions applied consistently over 30 years.
ENTRY CONDITIONS (all four must be true):
1. Close is below the 250-period simple moving average (bear regime confirmed)
2. Close is above the 5-period simple moving average (short-term bounce in progress)
3. 3-period RSI crosses above 70 (bounce is becoming overbought)
4. Close is at least 2% below the 250-period MA (keeps you away from the MA where direction is ambiguous)
EXIT CONDITIONS (first one triggered):
1. Close drops back below the 5-period MA (bounce has failed — trade worked)
2. Close rises above the 250-period MA (bear regime may be ending — get out)
All entries and exits are executed at the next bar open.
BACKTEST RESULTS (SPY daily, 1994–2025):
Win rate: 70.16%
Average winner: +1.77% — average hold 3.1 bars
Average loser: -2.12% — average hold 5.0 bars
BEAR MARKET PERFORMANCE vs SPY:
2000: System +8.31% | SPY -10.53%
2001: System +21.10% | SPY -12.86%
2002: System +1.55% | SPY -22.78%
2008: System +35.29% | SPY -36.71%
2022: System +20.29% | SPY -18.11%
HOW TO USE:
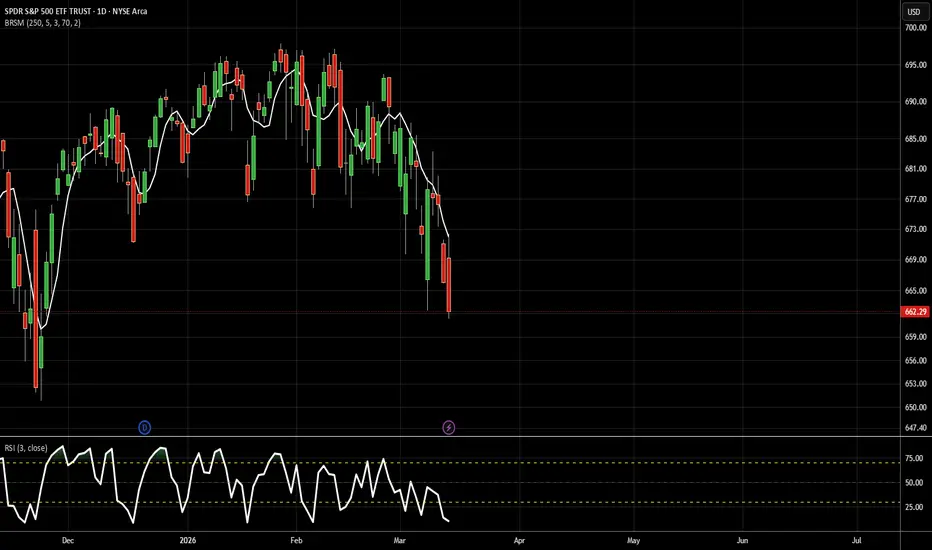
Apply to SPY on the daily timeframe. The 250 MA (yellow) and 5 MA (white) plot on the price chart. The companion RSI indicator plots in a separate pane below. Short entry signals appear as red triangles above the bar. Exit signals appear as green triangles below the bar.
Because SPY correlation with large-cap stocks runs high during bear markets, signals can also serve as a regime filter for shorting individual names or sector ETFs.
INPUTS (adjustable in settings):
- Long MA length (default 250)
- Short MA length (default 5)
- RSI length (default 3)
- RSI overbought threshold (default 70)
- Minimum % gap below long MA (default 2%)
Find more systems at:TradingTimeMachine.com/systems
DISCLAIMER:
Past performance is not indicative of future results. This script is for educational purposes only and does not constitute financial advice. Always do your own research before trading.
A rules-based short-selling strategy designed to profit during bear market regimes. Backtested on SPY daily data from 1994 to 2025 using Wealth-Lab 8.
The system identifies weak counter-trend bounces within established downtrends and shorts them with mechanical entry and exit rules. No discretion, no optimization — just objective conditions applied consistently over 30 years.
ENTRY CONDITIONS (all four must be true):
1. Close is below the 250-period simple moving average (bear regime confirmed)
2. Close is above the 5-period simple moving average (short-term bounce in progress)
3. 3-period RSI crosses above 70 (bounce is becoming overbought)
4. Close is at least 2% below the 250-period MA (keeps you away from the MA where direction is ambiguous)
EXIT CONDITIONS (first one triggered):
1. Close drops back below the 5-period MA (bounce has failed — trade worked)
2. Close rises above the 250-period MA (bear regime may be ending — get out)
All entries and exits are executed at the next bar open.
BACKTEST RESULTS (SPY daily, 1994–2025):
Win rate: 70.16%
Average winner: +1.77% — average hold 3.1 bars
Average loser: -2.12% — average hold 5.0 bars
BEAR MARKET PERFORMANCE vs SPY:
2000: System +8.31% | SPY -10.53%
2001: System +21.10% | SPY -12.86%
2002: System +1.55% | SPY -22.78%
2008: System +35.29% | SPY -36.71%
2022: System +20.29% | SPY -18.11%
HOW TO USE:
Apply to SPY on the daily timeframe. The 250 MA (yellow) and 5 MA (white) plot on the price chart. The companion RSI indicator plots in a separate pane below. Short entry signals appear as red triangles above the bar. Exit signals appear as green triangles below the bar.
Because SPY correlation with large-cap stocks runs high during bear markets, signals can also serve as a regime filter for shorting individual names or sector ETFs.
INPUTS (adjustable in settings):
- Long MA length (default 250)
- Short MA length (default 5)
- RSI length (default 3)
- RSI overbought threshold (default 70)
- Minimum % gap below long MA (default 2%)
Find more systems at:TradingTimeMachine.com/systems
DISCLAIMER:
Past performance is not indicative of future results. This script is for educational purposes only and does not constitute financial advice. Always do your own research before trading.

免責聲明
這些資訊和出版物並非旨在提供,也不構成TradingView提供或認可的任何形式的財務、投資、交易或其他類型的建議或推薦。請閱讀使用條款以了解更多資訊。
免責聲明
這些資訊和出版物並非旨在提供,也不構成TradingView提供或認可的任何形式的財務、投資、交易或其他類型的建議或推薦。請閱讀使用條款以了解更多資訊。