OPEN-SOURCE SCRIPT
已更新 Intraday EMA
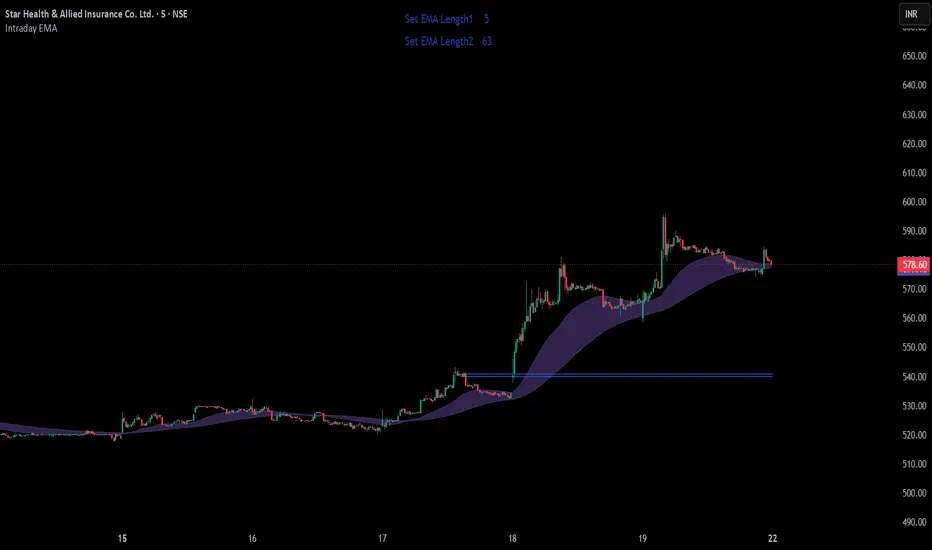
Short Description
Dynamic EMA Envelope based on recent hourly high/low structure with optional single EMA mode.
Full Publishing Description
Intraday EMA Envelope
Intraday EMA Envelope is a lightweight trend-following indicator designed for intraday traders who want adaptive EMA-based structure visualization.
The script derives EMA reference lengths from recent hourly market behavior using highest and lowest price offsets over a configurable lookback period.
Features
• Adaptive EMA logic based on hourly market structure
• Optional Single EMA mode
• EMA Envelope visualization with fill zone
• Smooth EMA calculations for cleaner trend tracking
• Real-time EMA length display table
• Mutually exclusive display modes for clean chart appearance
How It Works
The indicator scans hourly candles over the selected lookback period and calculates:
Highest high offset
Lowest low offset
These offsets are converted into dynamic EMA reference lengths.
Two smoothed EMAs are then plotted:
Upper EMA
Lower EMA
Users can choose between:
Single EMA mode
EMA Envelope mode
Both modes are intentionally made mutually exclusive to avoid chart clutter.
Inputs
• Lookback Days
Controls the hourly historical range used for EMA calculations.
• Show Single EMA
Displays only one smoothed EMA.
• Show EMA Envelope
Displays the EMA channel/envelope with fill.
Best Usage
This indicator works best for:
Intraday trend identification
Pullback trading
Dynamic support/resistance tracking
Trend continuation setups
Dynamic EMA Envelope based on recent hourly high/low structure with optional single EMA mode.
Full Publishing Description
Intraday EMA Envelope
Intraday EMA Envelope is a lightweight trend-following indicator designed for intraday traders who want adaptive EMA-based structure visualization.
The script derives EMA reference lengths from recent hourly market behavior using highest and lowest price offsets over a configurable lookback period.
Features
• Adaptive EMA logic based on hourly market structure
• Optional Single EMA mode
• EMA Envelope visualization with fill zone
• Smooth EMA calculations for cleaner trend tracking
• Real-time EMA length display table
• Mutually exclusive display modes for clean chart appearance
How It Works
The indicator scans hourly candles over the selected lookback period and calculates:
Highest high offset
Lowest low offset
These offsets are converted into dynamic EMA reference lengths.
Two smoothed EMAs are then plotted:
Upper EMA
Lower EMA
Users can choose between:
Single EMA mode
EMA Envelope mode
Both modes are intentionally made mutually exclusive to avoid chart clutter.
Inputs
• Lookback Days
Controls the hourly historical range used for EMA calculations.
• Show Single EMA
Displays only one smoothed EMA.
• Show EMA Envelope
Displays the EMA channel/envelope with fill.
Best Usage
This indicator works best for:
Intraday trend identification
Pullback trading
Dynamic support/resistance tracking
Trend continuation setups
發行說明
Added :- EMA Cycle Confluence Detector [LCM Based]""Identifies synchronization points between two EMA cycle lengths using Least Common Multiple (LCM) calculations and automatically plots the latest confluence high-low zone for support and resistance analysis."
開源腳本
秉持TradingView一貫精神,這個腳本的創作者將其設為開源,以便交易者檢視並驗證其功能。向作者致敬!您可以免費使用此腳本,但請注意,重新發佈代碼需遵守我們的社群規範。

免責聲明
這些資訊和出版物並非旨在提供,也不構成TradingView提供或認可的任何形式的財務、投資、交易或其他類型的建議或推薦。請閱讀使用條款以了解更多資訊。
開源腳本
秉持TradingView一貫精神,這個腳本的創作者將其設為開源,以便交易者檢視並驗證其功能。向作者致敬!您可以免費使用此腳本,但請注意,重新發佈代碼需遵守我們的社群規範。
免責聲明
這些資訊和出版物並非旨在提供,也不構成TradingView提供或認可的任何形式的財務、投資、交易或其他類型的建議或推薦。請閱讀使用條款以了解更多資訊。