OPEN-SOURCE SCRIPT
MAGIC Auto Fib Extension Entry SL TP with Win Loss Stats
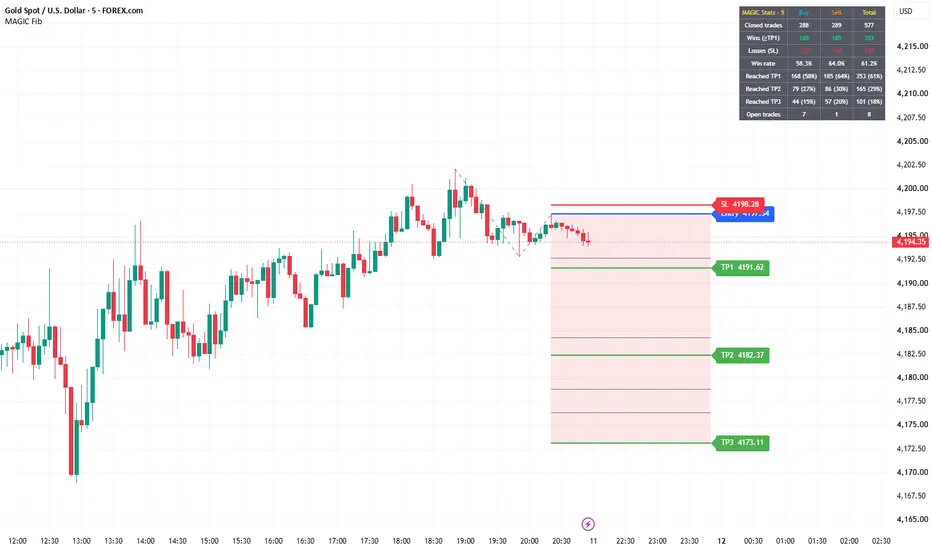
MAGIC Auto Fib Extension automatically finds market swings and draws a Trend-Based Fibonacci Extension with ready-made Entry, Stop Loss and three Take Profit levels — plus a dashboard that tracks how every past signal performed.
HOW IT WORKS
1. Swing detection
The script uses pivot highs and lows (adjustable left/right bars) to build an alternating chain of swing points.
2. A → B → C pattern
- Bullish: A = swing low, B = swing high, C = higher low between A and B.
- Bearish: A = swing high, B = swing low, C = lower high between B and A.
3. Fib extension
Levels are projected from point C using the A→B leg:
Level price = C ± (B − A) × ratio
Default "MAGIC" ratios: 0, 0.5, 0.618, 1.414, 1.618, 2, 2.272, 2.618 (all editable, each can be turned on/off).
4. Trade levels
- Entry = point C (level 0)
- Stop Loss = beyond point C or beyond point A, with an ATR(14) buffer
- TP1 / TP2 / TP3 = selectable fib levels (default 0.618 / 1.618 / 2.618)
Labels are updated with ✓ when a TP is reached and ✗ when the SL is hit.
CLEAN CHART
Only the latest setup is drawn by default ("Setups kept on chart" = 1). Older setups are removed from the chart but are still tracked in the background, so the statistics stay complete.
WIN / LOSS DASHBOARD
Shows Buy, Sell and Total columns:
- Closed trades, Wins, Losses, Win rate
- How many trades reached TP1, TP2 and TP3
- Currently open trades
Rules: a trade that reaches TP1 counts as a win (even if SL is hit afterwards). A trade that hits SL before TP1 counts as a loss. A trade closes at SL or TP3. If SL and a TP are touched in the same candle, SL is assumed first (conservative).
ALERTS
- New bullish / bearish setup (with Entry, SL, TP1–TP3 in the message)
- TP1, TP2, TP3 hit
- SL hit
SETTINGS
Pivot lengths, bull/bear filter, fib levels, TP levels, SL mode and ATR buffer, colours, background fill, level values/prices, dashboard position, and optional markers for past signals.
IMPORTANT NOTES
- A setup is confirmed only after point C is confirmed as a pivot (after "Pivot right bars" candles). By then price may have moved away from point C, so the dashboard statistics assume an entry at C and may look better than real-time trading results.
- Statistics are based on the chart history loaded in TradingView and change with symbol and timeframe.
- This indicator is a tool for analysis and education. It is not financial advice and past results do not guarantee future performance. Always use proper risk management.
TRADE MANAGEMENT
Once TP1 is reached, move the Stop Loss to Cost to Cost (breakeven at the entry price). This protects the trade, and the remaining position can run towards TP2 and TP3 risk-free.
HOW IT WORKS
1. Swing detection
The script uses pivot highs and lows (adjustable left/right bars) to build an alternating chain of swing points.
2. A → B → C pattern
- Bullish: A = swing low, B = swing high, C = higher low between A and B.
- Bearish: A = swing high, B = swing low, C = lower high between B and A.
3. Fib extension
Levels are projected from point C using the A→B leg:
Level price = C ± (B − A) × ratio
Default "MAGIC" ratios: 0, 0.5, 0.618, 1.414, 1.618, 2, 2.272, 2.618 (all editable, each can be turned on/off).
4. Trade levels
- Entry = point C (level 0)
- Stop Loss = beyond point C or beyond point A, with an ATR(14) buffer
- TP1 / TP2 / TP3 = selectable fib levels (default 0.618 / 1.618 / 2.618)
Labels are updated with ✓ when a TP is reached and ✗ when the SL is hit.
CLEAN CHART
Only the latest setup is drawn by default ("Setups kept on chart" = 1). Older setups are removed from the chart but are still tracked in the background, so the statistics stay complete.
WIN / LOSS DASHBOARD
Shows Buy, Sell and Total columns:
- Closed trades, Wins, Losses, Win rate
- How many trades reached TP1, TP2 and TP3
- Currently open trades
Rules: a trade that reaches TP1 counts as a win (even if SL is hit afterwards). A trade that hits SL before TP1 counts as a loss. A trade closes at SL or TP3. If SL and a TP are touched in the same candle, SL is assumed first (conservative).
ALERTS
- New bullish / bearish setup (with Entry, SL, TP1–TP3 in the message)
- TP1, TP2, TP3 hit
- SL hit
SETTINGS
Pivot lengths, bull/bear filter, fib levels, TP levels, SL mode and ATR buffer, colours, background fill, level values/prices, dashboard position, and optional markers for past signals.
IMPORTANT NOTES
- A setup is confirmed only after point C is confirmed as a pivot (after "Pivot right bars" candles). By then price may have moved away from point C, so the dashboard statistics assume an entry at C and may look better than real-time trading results.
- Statistics are based on the chart history loaded in TradingView and change with symbol and timeframe.
- This indicator is a tool for analysis and education. It is not financial advice and past results do not guarantee future performance. Always use proper risk management.
TRADE MANAGEMENT
Once TP1 is reached, move the Stop Loss to Cost to Cost (breakeven at the entry price). This protects the trade, and the remaining position can run towards TP2 and TP3 risk-free.
開源腳本
秉持TradingView一貫精神,這個腳本的創作者將其設為開源,以便交易者檢視並驗證其功能。向作者致敬!您可以免費使用此腳本,但請注意,重新發佈代碼需遵守我們的社群規範。

免責聲明
這些資訊和出版物並非旨在提供,也不構成TradingView提供或認可的任何形式的財務、投資、交易或其他類型的建議或推薦。請閱讀使用條款以了解更多資訊。
開源腳本
秉持TradingView一貫精神,這個腳本的創作者將其設為開源,以便交易者檢視並驗證其功能。向作者致敬!您可以免費使用此腳本,但請注意,重新發佈代碼需遵守我們的社群規範。
免責聲明
這些資訊和出版物並非旨在提供,也不構成TradingView提供或認可的任何形式的財務、投資、交易或其他類型的建議或推薦。請閱讀使用條款以了解更多資訊。