OPEN-SOURCE SCRIPT
Volume Profile - Accurate
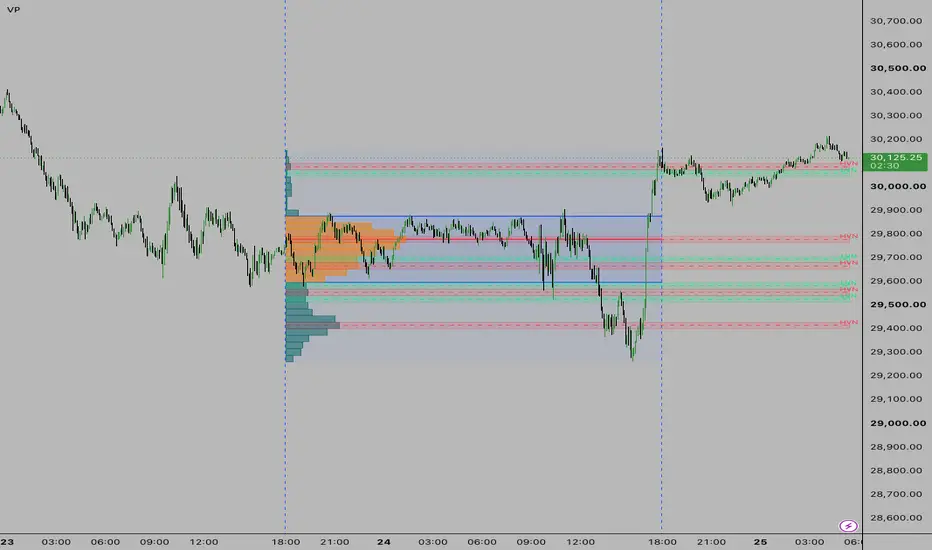
Core Architecture
1. Lower-Timeframe Precision Engine Traditional volume profiles on TradingView can be inaccurate because they guess the volume distribution within a daily candle. This script actually pulls raw data from a lower Source TF (default 5-minute) using request.security_lower_tf and mathematically reconstructs the exact volume traded at every single price tick for the entire day.
2. The Histogram (The Profile itself) It divides the entire price range of the period into a set number of horizontal rows (default 24). It then sorts the lower timeframe volume into these rows, painting a histogram (horizontal bars) on the side of the chart.
Key Trading Features
1. Point of Control (POC) The script mathematically isolates the single row with the absolute highest traded volume for the period.
Action: It projects a solid red line across the chart at this exact price level. The POC acts as the ultimate "fair value" price where buyers and sellers agreed the most, making it a massive magnet for future price action and a strong support/resistance level.
2. Value Area (VA) It calculates the core range where the majority of the trading took place (default is 68% of all volume, representing one standard deviation).
Action: It plots the Value Area High (VAH) and Value Area Low (VAL) as blue lines, and dynamically fills the background between them. Trading outside the Value Area represents an imbalance, while trading inside it represents balance.
3. Advanced Node Detection (HVN & LVN) This is where the script shines. It doesn't just plot the profile; it uses an algorithm to scan the shape of the profile and identify specific structural anomalies:
HVN (High Volume Nodes): Peaks in the profile (other than the POC). The script automatically draws red dashed lines and boxes at these levels. They act as localized support/resistance ledges.
LVN (Low Volume Nodes): Valleys or "gaps" in the profile where price moved so fast that almost zero volume was traded.
LVN Areas: The script goes a step further and intelligently groups adjacent LVNs together to create an "LVN Area" box (default Lime Green). Because there is no historical volume here to stop the price, if price enters an LVN Area, it will usually slice right through it like a hot knife
through butter.
Visual Control
It uses Pine Script's array-based object management (array<box>, array<line>) to dynamically clean up and redraw the profile flawlessly on every tick. You have full control in the settings over where the profile draws (Left/Right), its width, the color of the Value area vs outside the Value area, and toggles for every single specific node.
1. Lower-Timeframe Precision Engine Traditional volume profiles on TradingView can be inaccurate because they guess the volume distribution within a daily candle. This script actually pulls raw data from a lower Source TF (default 5-minute) using request.security_lower_tf and mathematically reconstructs the exact volume traded at every single price tick for the entire day.
2. The Histogram (The Profile itself) It divides the entire price range of the period into a set number of horizontal rows (default 24). It then sorts the lower timeframe volume into these rows, painting a histogram (horizontal bars) on the side of the chart.
Key Trading Features
1. Point of Control (POC) The script mathematically isolates the single row with the absolute highest traded volume for the period.
Action: It projects a solid red line across the chart at this exact price level. The POC acts as the ultimate "fair value" price where buyers and sellers agreed the most, making it a massive magnet for future price action and a strong support/resistance level.
2. Value Area (VA) It calculates the core range where the majority of the trading took place (default is 68% of all volume, representing one standard deviation).
Action: It plots the Value Area High (VAH) and Value Area Low (VAL) as blue lines, and dynamically fills the background between them. Trading outside the Value Area represents an imbalance, while trading inside it represents balance.
3. Advanced Node Detection (HVN & LVN) This is where the script shines. It doesn't just plot the profile; it uses an algorithm to scan the shape of the profile and identify specific structural anomalies:
HVN (High Volume Nodes): Peaks in the profile (other than the POC). The script automatically draws red dashed lines and boxes at these levels. They act as localized support/resistance ledges.
LVN (Low Volume Nodes): Valleys or "gaps" in the profile where price moved so fast that almost zero volume was traded.
LVN Areas: The script goes a step further and intelligently groups adjacent LVNs together to create an "LVN Area" box (default Lime Green). Because there is no historical volume here to stop the price, if price enters an LVN Area, it will usually slice right through it like a hot knife
through butter.
Visual Control
It uses Pine Script's array-based object management (array<box>, array<line>) to dynamically clean up and redraw the profile flawlessly on every tick. You have full control in the settings over where the profile draws (Left/Right), its width, the color of the Value area vs outside the Value area, and toggles for every single specific node.
開源腳本
秉持TradingView一貫精神,這個腳本的創作者將其設為開源,以便交易者檢視並驗證其功能。向作者致敬!您可以免費使用此腳本,但請注意,重新發佈代碼需遵守我們的社群規範。

免責聲明
這些資訊和出版物並非旨在提供,也不構成TradingView提供或認可的任何形式的財務、投資、交易或其他類型的建議或推薦。請閱讀使用條款以了解更多資訊。
免責聲明
這些資訊和出版物並非旨在提供,也不構成TradingView提供或認可的任何形式的財務、投資、交易或其他類型的建議或推薦。請閱讀使用條款以了解更多資訊。