OPEN-SOURCE SCRIPT
Bridgewater All-Weather [JOAT]
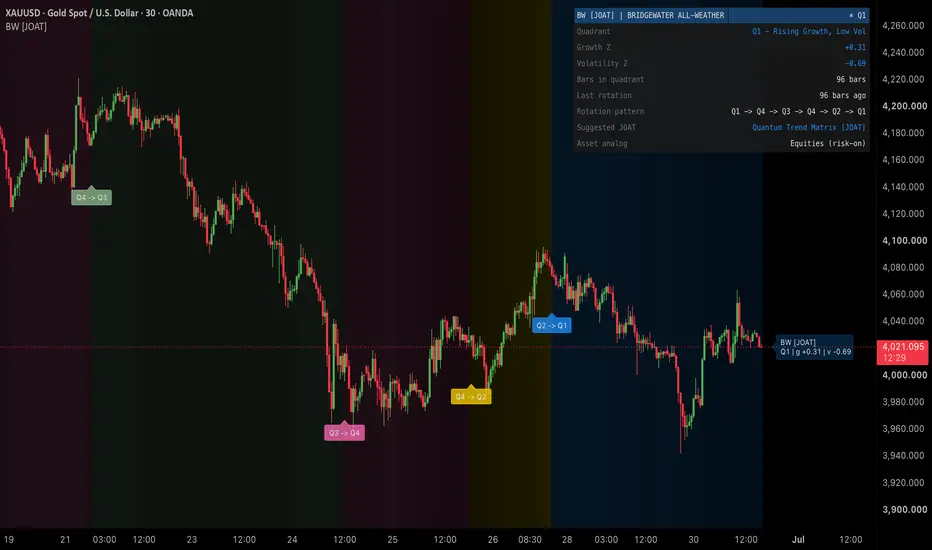
BRIDGEWATER ALL-WEATHER [JOAT]
A tribute to Ray Dalio's All-Weather framework — the macro-regime engine that classifies the current environment along two orthogonal axes: growth (rising or falling) and inflation/volatility (rising or falling) — and maps the resulting quadrant to the asset class that historically performs best in that regime. Bridgewater All-Weather distils that idea into a Pine script: a quadrant classifier built on Z-scored growth and volatility proxies, a 2×2 mini-chart rendered on the chart itself, a regime-tinted background, a rotation-event label, and a Suggested-JOAT-Indicator row that names the best companion script for the current quadrant.

The four quadrants
The asset-class analogues are Dalio's institutional defaults; they can be toggled off if you want pure regime classification without the asset overlay.
Growth and Vol proxies
Macro frameworks need macro inputs. The script approximates the two factors purely from chart data so it runs on any instrument:
A configurable Z dead-zone (default ±0.10) treats small Z values as neutral and refuses to register quadrant changes until the Z moves clearly off zero. This eliminates flicker between adjacent quadrants when the signal is genuinely uncertain.
Minimum-bars-hold filter
A quadrant must persist for at least N bars (default 3) before a rotation is committed. This prevents whipsaw classification when growth and volatility cross their respective zero lines on the same bar.
Mini 2D quadrant chart
The script's signature visual: a 2×2 grid rendered directly on the chart (anchored to any of four corners, with configurable cell size in bars and price-height in ATR units). The currently-active quadrant is highlighted in its quadrant colour; the other three are muted. At a glance you see the entire four-state regime classification mapped to its asset analogue. The four hues appear simultaneously only in the mini chart — by design — because elsewhere the script obeys strict one-active-quadrant colour discipline.
Visual system
A locked Sapphire palette: one hue per quadrant (Q1 blue, Q2 gold, Q3 sage, Q4 pink). Because only one quadrant is active at a time, the chart only ever shows one family + the muted background. The strict 4-hue discipline only appears in the mini chart.

Suggested JOAT Indicator row
The dashboard exposes a Suggested Indicator row that names the best-fit companion from the JOAT suite per quadrant. Defaults:
Every suggestion is user-configurable.
Dashboard
Monospaced table, positionable to any of nine corners, with optional row-gradient. Surfaces:
Alerts
Three alert conditions, each independently controllable:
How to read it
Three reads, in order of conviction:
Suggested settings
Defaults (growth 100 / vol 100 / baseline 252 / dead-zone 0.10 / 3-bar hold) are calibrated to daily charts on broad indices. For lower timeframes drop windows proportionally. For weekly+ raise to 200 / 200 / 500. The dead-zone is the single most important anti-flicker input; widen if your instrument has noisy growth/vol behaviour.
Originality / what's reused
The All-Weather framework is Ray Dalio / Bridgewater Associates' published macro philosophy — a public conceptual framework, not proprietary code. The implementation here — the chart-data-only growth and volatility proxies, the Z-baseline normalisation with dead-zone gate, the minimum-bars-hold rotation filter, the 2×2 mini-chart render in chart units with ATR-scaled cell height, the per-quadrant single-hue palette discipline, the suggested-JOAT-indicator dashboard row, and the rotation-event label engine — is JOAT-original. No third-party code reused. The script is a tribute, not a direct replication of any proprietary Bridgewater model.
Limitations
The growth and volatility proxies are computed from chart data only — they are approximations, not the macroeconomic series an actual All-Weather portfolio uses. The Z-baseline assumes 252 bars approximates a trading year; on non-daily timeframes the interpretation shifts (e.g. on 1H, 252 bars is roughly 10 trading days). The quadrant classification is descriptive of recent chart behaviour, not of the broader macro environment — pair with macro context for serious portfolio decisions.
—
-made with passion by jackofalltrades
A tribute to Ray Dalio's All-Weather framework — the macro-regime engine that classifies the current environment along two orthogonal axes: growth (rising or falling) and inflation/volatility (rising or falling) — and maps the resulting quadrant to the asset class that historically performs best in that regime. Bridgewater All-Weather distils that idea into a Pine script: a quadrant classifier built on Z-scored growth and volatility proxies, a 2×2 mini-chart rendered on the chart itself, a regime-tinted background, a rotation-event label, and a Suggested-JOAT-Indicator row that names the best companion script for the current quadrant.
The four quadrants
- Q1 — Growth UP, Vol DOWN — Risk-On / Equities regime. Blue.
- Q2 — Growth UP, Vol UP — Inflation / Commodities regime. Gold.
- Q3 — Growth DOWN, Vol DOWN — Disinflation / Bonds regime. Sage.
- Q4 — Growth DOWN, Vol UP — Crisis / Gold regime. Pink.
The asset-class analogues are Dalio's institutional defaults; they can be toggled off if you want pure regime classification without the asset overlay.
Growth and Vol proxies
Macro frameworks need macro inputs. The script approximates the two factors purely from chart data so it runs on any instrument:
- Growth proxy — long-window smoothed return (default 100-bar EMA-smoothed return). Z-scored against a long baseline (default 252 bars, the trading-year canonical).
- Volatility proxy — rolling standard deviation of returns over the volatility window (default 100 bars). Z-scored against the same baseline.
A configurable Z dead-zone (default ±0.10) treats small Z values as neutral and refuses to register quadrant changes until the Z moves clearly off zero. This eliminates flicker between adjacent quadrants when the signal is genuinely uncertain.
Minimum-bars-hold filter
A quadrant must persist for at least N bars (default 3) before a rotation is committed. This prevents whipsaw classification when growth and volatility cross their respective zero lines on the same bar.
Mini 2D quadrant chart
The script's signature visual: a 2×2 grid rendered directly on the chart (anchored to any of four corners, with configurable cell size in bars and price-height in ATR units). The currently-active quadrant is highlighted in its quadrant colour; the other three are muted. At a glance you see the entire four-state regime classification mapped to its asset analogue. The four hues appear simultaneously only in the mini chart — by design — because elsewhere the script obeys strict one-active-quadrant colour discipline.
Visual system
- Background tint by active quadrant (configurable transparency, default 92 institutional-subtle).
- Quadrant badge — right-side floating label showing the active quadrant with its colour. Configurable corner.
- Rotation label — drops a label on the chart every time the quadrant changes.
- Mini 2D quadrant chart (the signature) — 2×2 grid in the chosen corner.
- Hidden growth-Z and vol-Z line plots — for users who want to see the underlying scores in the Data Window or feed them to alerts. Off by default.
A locked Sapphire palette: one hue per quadrant (Q1 blue, Q2 gold, Q3 sage, Q4 pink). Because only one quadrant is active at a time, the chart only ever shows one family + the muted background. The strict 4-hue discipline only appears in the mini chart.
Suggested JOAT Indicator row
The dashboard exposes a Suggested Indicator row that names the best-fit companion from the JOAT suite per quadrant. Defaults:
- Q1 (risk-on) → Quantum Trend Matrix (trend amplification in a benign environment).
- Q2 (inflation) → Liquid Reversal Engine (mean-reversion bands in a volatile-up regime).
- Q3 (disinflation) → Smart SR Zones (structure-focused reads in a calming environment).
- Q4 (crisis) → Z-Score Flow Pro (extreme-statistics regime for risk-off conditions).
Every suggestion is user-configurable.
Dashboard
Monospaced table, positionable to any of nine corners, with optional row-gradient. Surfaces:
- Active quadrant with asset analogue.
- Growth Z value and direction.
- Vol Z value and direction.
- Bars in current quadrant.
- Last rotation: from → to with bars-ago.
- Suggested JOAT Indicator (toggleable).
Alerts
Three alert conditions, each independently controllable:
- Any Quadrant Rotation
- Entered Q4 (Risk-Off / Crisis) — the most actionable single alert; usually accompanies risk-off moves across asset classes.
- Entered Q1 (Risk-On) — off by default; useful for trend-following entry timing.
How to read it
Three reads, in order of conviction:
- Q4 entry — the highest-priority macro alert. Growth is falling and volatility is rising — historically the regime in which risk assets sell off, gold rallies, and defensive positioning wins. Reduce risk exposure regardless of the chart-timeframe signal.
- Sustained Q1 — the trend amplifier. The market is in a healthy growth/calm environment; momentum tools have their largest edge. The mini chart visually confirms the regime.
- Rotation between adjacent quadrants (e.g. Q1 → Q2 or Q3 → Q4) — regime-transition warning. The market is rotating along one of the two axes; this often precedes the larger directional move.
Suggested settings
Defaults (growth 100 / vol 100 / baseline 252 / dead-zone 0.10 / 3-bar hold) are calibrated to daily charts on broad indices. For lower timeframes drop windows proportionally. For weekly+ raise to 200 / 200 / 500. The dead-zone is the single most important anti-flicker input; widen if your instrument has noisy growth/vol behaviour.
Originality / what's reused
The All-Weather framework is Ray Dalio / Bridgewater Associates' published macro philosophy — a public conceptual framework, not proprietary code. The implementation here — the chart-data-only growth and volatility proxies, the Z-baseline normalisation with dead-zone gate, the minimum-bars-hold rotation filter, the 2×2 mini-chart render in chart units with ATR-scaled cell height, the per-quadrant single-hue palette discipline, the suggested-JOAT-indicator dashboard row, and the rotation-event label engine — is JOAT-original. No third-party code reused. The script is a tribute, not a direct replication of any proprietary Bridgewater model.
Limitations
The growth and volatility proxies are computed from chart data only — they are approximations, not the macroeconomic series an actual All-Weather portfolio uses. The Z-baseline assumes 252 bars approximates a trading year; on non-daily timeframes the interpretation shifts (e.g. on 1H, 252 bars is roughly 10 trading days). The quadrant classification is descriptive of recent chart behaviour, not of the broader macro environment — pair with macro context for serious portfolio decisions.
—
-made with passion by jackofalltrades
開源腳本
秉持TradingView一貫精神,這個腳本的創作者將其設為開源,以便交易者檢視並驗證其功能。向作者致敬!您可以免費使用此腳本,但請注意,重新發佈代碼需遵守我們的社群規範。

The Institutional Grade Trading Ecosystem, Built to win trades 📈
Get Access 👇
jackofalltrades.vip 🌐
t.me/jackofalltradesvip 🃏
Get Access 👇
jackofalltrades.vip 🌐
t.me/jackofalltradesvip 🃏
免責聲明
這些資訊和出版物並非旨在提供,也不構成TradingView提供或認可的任何形式的財務、投資、交易或其他類型的建議或推薦。請閱讀使用條款以了解更多資訊。
開源腳本
秉持TradingView一貫精神,這個腳本的創作者將其設為開源,以便交易者檢視並驗證其功能。向作者致敬!您可以免費使用此腳本,但請注意,重新發佈代碼需遵守我們的社群規範。
The Institutional Grade Trading Ecosystem, Built to win trades 📈
Get Access 👇
jackofalltrades.vip 🌐
t.me/jackofalltradesvip 🃏
Get Access 👇
jackofalltrades.vip 🌐
t.me/jackofalltradesvip 🃏
免責聲明
這些資訊和出版物並非旨在提供,也不構成TradingView提供或認可的任何形式的財務、投資、交易或其他類型的建議或推薦。請閱讀使用條款以了解更多資訊。