Previous high to Close Previous low to Close fib levels
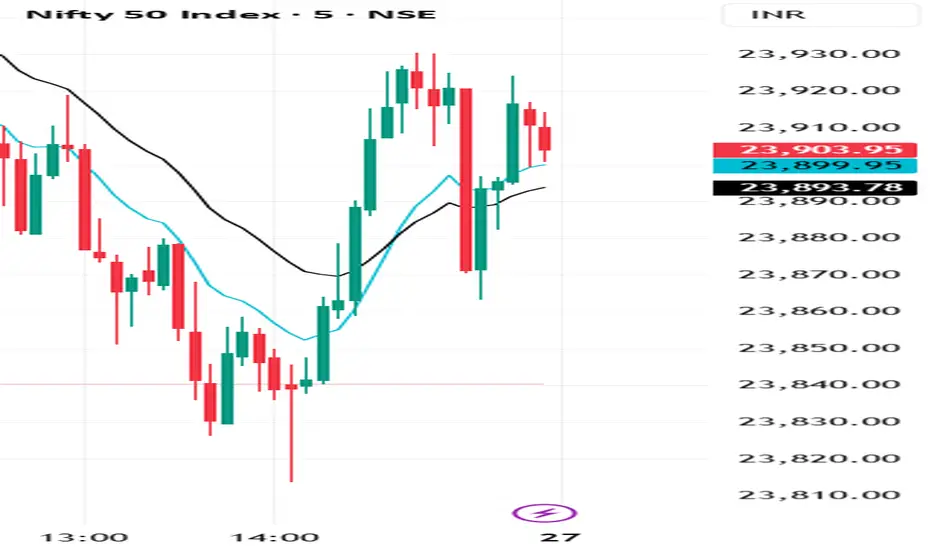
This script, Fib Bridge: H/L to First Close, is a specialized technical analysis tool designed to identify intraday support and resistance levels based on the relationship between previous period extremes and the opening price action.
Core Functionality
Anchor Periods: Automatically calculates levels based on the Previous Day or Previous Week high/low.
The "Fib Bridge": It constructs Fibonacci-style "bridges" between the previous period's high/low and the closing price of the first candle of the current session.
ORB Levels: Visualizes the Opening Range Breakout (ORB) High, Low, and Midpoint of the first candle for immediate bias.
Bull & Bear Zones: * Bull Bridge: Projects the 50% midpoint between the Previous Low and the first Close.
Bear Bridge: Projects the 50% midpoint between the Previous High and the first Close.
Dynamic Visuals: Includes real-time line extensions and customizable labels for price precision.
Core Functionality
Anchor Periods: Automatically calculates levels based on the Previous Day or Previous Week high/low.
The "Fib Bridge": It constructs Fibonacci-style "bridges" between the previous period's high/low and the closing price of the first candle of the current session.
ORB Levels: Visualizes the Opening Range Breakout (ORB) High, Low, and Midpoint of the first candle for immediate bias.
Bull & Bear Zones: * Bull Bridge: Projects the 50% midpoint between the Previous Low and the first Close.
Bear Bridge: Projects the 50% midpoint between the Previous High and the first Close.
Dynamic Visuals: Includes real-time line extensions and customizable labels for price precision.

免責聲明
這些資訊和出版物並非旨在提供,也不構成TradingView提供或認可的任何形式的財務、投資、交易或其他類型的建議或推薦。請閱讀使用條款以了解更多資訊。
免責聲明
這些資訊和出版物並非旨在提供,也不構成TradingView提供或認可的任何形式的財務、投資、交易或其他類型的建議或推薦。請閱讀使用條款以了解更多資訊。