Manual Anchor VWAP | julzALGO
📘 Summary
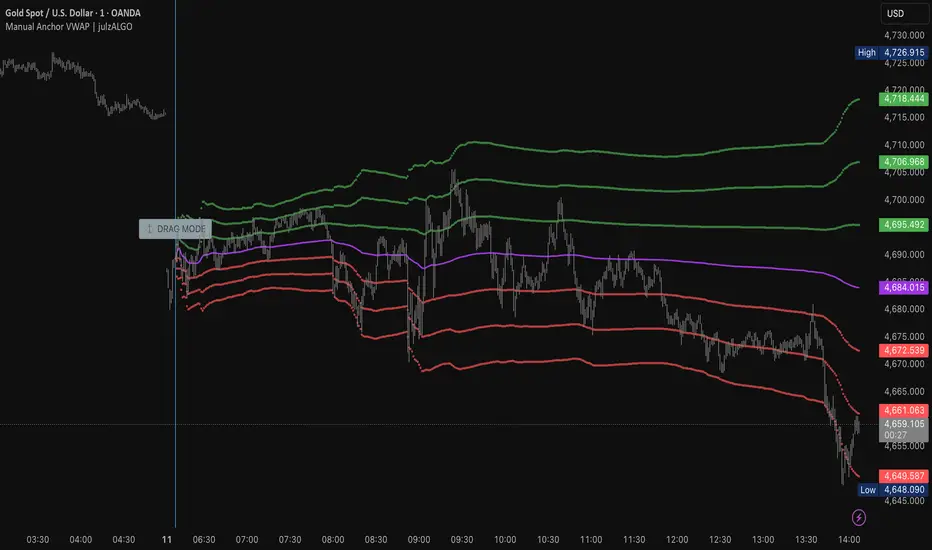
Manual Anchor VWAP is a fully manual anchored VWAP system designed around a draggable institutional anchor point.
Instead of relying on automatic session resets, the user manually selects where the VWAP calculation begins using the ⚓ DRAG MODE anchor.
This allows traders to anchor VWAP directly to important market events such as:
• Breakouts
• Liquidity sweeps
• Displacement candles
• BOS
• CHoCH
• News spikes
• Major swing highs/lows
The script also includes configurable standard deviation bands to visualize volatility expansion and premium/discount positioning around the anchored VWAP.
📘 Features
✅ Fully manual anchored VWAP
✅ Interactive ⚓ DRAG MODE anchor
✅ Vertical anchor reference line
✅ ±1σ standard deviation bands
✅ ±2σ standard deviation bands
✅ ±3σ standard deviation bands
✅ Institutional-style anchored workflow
✅ Lightweight and clean overlay design
✅ Real-time VWAP recalculation from anchor point
✅ Customizable VWAP, anchor, line, and band colors
📘 Logic
The script calculates VWAP manually from the selected anchor point using cumulative price-volume calculations.
Core calculation:
VWAP = Σ(price × volume) / Σ(volume)
The VWAP begins accumulating only after the manually selected anchor time.
The anchor is controlled through:
⚓ DRAG MODE

This allows traders to reposition the starting point dynamically depending on the market structure or event they want to analyze.
Standard deviation bands are calculated using volume-weighted variance from the anchored VWAP mean.
This creates institutional-style premium and discount zones around the anchor.
📘 Usage
🔷 Best Anchor Locations
⚓ Liquidity sweeps
⚓ BOS candles
⚓ CHoCH candles
⚓ Strong displacement candles
⚓ News events
⚓ Session opens
⚓ Swing highs and swing lows
⚓ Breakout or breakdown candles
🔷 Institutional Interpretation
The anchored VWAP acts as a dynamic institutional average price from the selected event.
Price above VWAP:
→ Buyers are holding control above institutional average price.
Price below VWAP:
→ Sellers are holding control below institutional average price.
Standard deviation bands help identify:
• Premium zones
• Discount zones
• Exhaustion areas
• Mean reversion areas
• Expansion and volatility extremes
🔷 Example Workflow
⚓ Anchor VWAP at a bullish displacement candle
⬆ Price pulls back into VWAP
🟢 Buyers defend anchored average price
📈 Continuation toward upper deviation bands
Or:
⚓ Anchor VWAP at a liquidity sweep high
⬇ Price rejects below VWAP
🔴 Sellers defend premium area
📉 Continuation toward lower deviation bands
📘 Settings
⚓ Anchor
• Drag Anchor
• Price
• Show Anchor Line
📊 Bands
• Band 1
• Band 2
• Band 3
• Show Bands
🎨 Colors
• VWAP Color
• Anchor Label Color
• Vertical Drag Line Color
• Upper Band Color
• Lower Band Color
📘 Disclaimer
This script is for educational and informational purposes only.
Anchored VWAP analysis does not guarantee future market direction or profitability. Traders should always combine anchored VWAP with proper risk management, market structure analysis, and confirmation tools before making trading decisions.
Manual Anchor VWAP is a fully manual anchored VWAP system designed around a draggable institutional anchor point.
Instead of relying on automatic session resets, the user manually selects where the VWAP calculation begins using the ⚓ DRAG MODE anchor.
This allows traders to anchor VWAP directly to important market events such as:
• Breakouts
• Liquidity sweeps
• Displacement candles
• BOS
• CHoCH
• News spikes
• Major swing highs/lows
The script also includes configurable standard deviation bands to visualize volatility expansion and premium/discount positioning around the anchored VWAP.
📘 Features
✅ Fully manual anchored VWAP
✅ Interactive ⚓ DRAG MODE anchor
✅ Vertical anchor reference line
✅ ±1σ standard deviation bands
✅ ±2σ standard deviation bands
✅ ±3σ standard deviation bands
✅ Institutional-style anchored workflow
✅ Lightweight and clean overlay design
✅ Real-time VWAP recalculation from anchor point
✅ Customizable VWAP, anchor, line, and band colors
📘 Logic
The script calculates VWAP manually from the selected anchor point using cumulative price-volume calculations.
Core calculation:
VWAP = Σ(price × volume) / Σ(volume)
The VWAP begins accumulating only after the manually selected anchor time.
The anchor is controlled through:
⚓ DRAG MODE
This allows traders to reposition the starting point dynamically depending on the market structure or event they want to analyze.
Standard deviation bands are calculated using volume-weighted variance from the anchored VWAP mean.
This creates institutional-style premium and discount zones around the anchor.
📘 Usage
🔷 Best Anchor Locations
⚓ Liquidity sweeps
⚓ BOS candles
⚓ CHoCH candles
⚓ Strong displacement candles
⚓ News events
⚓ Session opens
⚓ Swing highs and swing lows
⚓ Breakout or breakdown candles
🔷 Institutional Interpretation
The anchored VWAP acts as a dynamic institutional average price from the selected event.
Price above VWAP:
→ Buyers are holding control above institutional average price.
Price below VWAP:
→ Sellers are holding control below institutional average price.
Standard deviation bands help identify:
• Premium zones
• Discount zones
• Exhaustion areas
• Mean reversion areas
• Expansion and volatility extremes
🔷 Example Workflow
⚓ Anchor VWAP at a bullish displacement candle
⬆ Price pulls back into VWAP
🟢 Buyers defend anchored average price
📈 Continuation toward upper deviation bands
Or:
⚓ Anchor VWAP at a liquidity sweep high
⬇ Price rejects below VWAP
🔴 Sellers defend premium area
📉 Continuation toward lower deviation bands
📘 Settings
⚓ Anchor
• Drag Anchor
• Price
• Show Anchor Line
📊 Bands
• Band 1
• Band 2
• Band 3
• Show Bands
🎨 Colors
• VWAP Color
• Anchor Label Color
• Vertical Drag Line Color
• Upper Band Color
• Lower Band Color
📘 Disclaimer
This script is for educational and informational purposes only.
Anchored VWAP analysis does not guarantee future market direction or profitability. Traders should always combine anchored VWAP with proper risk management, market structure analysis, and confirmation tools before making trading decisions.

Official julzALGO Community:
discord.gg/FJkAYEAH
discord.gg/FJkAYEAH
免責聲明
這些資訊和出版物並非旨在提供,也不構成TradingView提供或認可的任何形式的財務、投資、交易或其他類型的建議或推薦。請閱讀使用條款以了解更多資訊。
Official julzALGO Community:
discord.gg/FJkAYEAH
discord.gg/FJkAYEAH
免責聲明
這些資訊和出版物並非旨在提供,也不構成TradingView提供或認可的任何形式的財務、投資、交易或其他類型的建議或推薦。請閱讀使用條款以了解更多資訊。