OPEN-SOURCE SCRIPT
已更新 Core Structure Break [UkutaLabs]
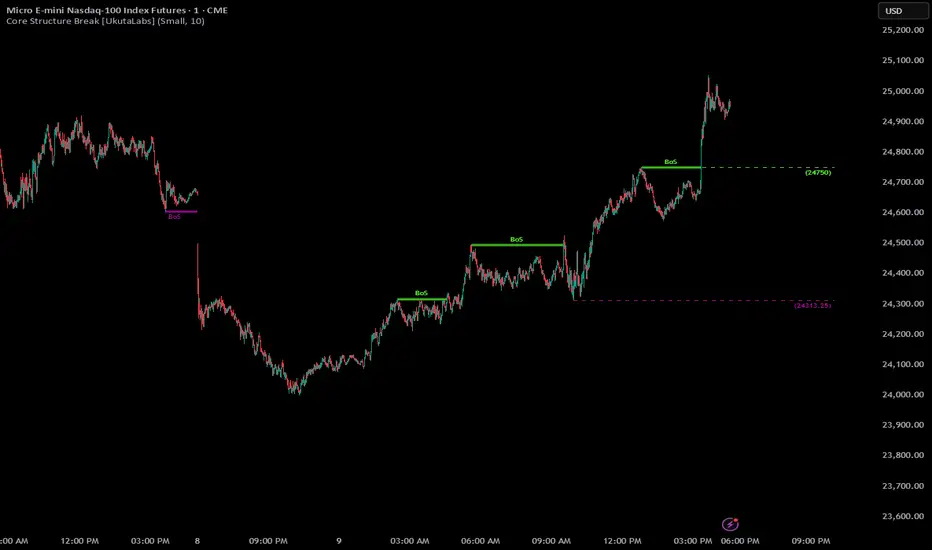
█ OVERVIEW
Core Structure Break is designed to automatically detect Breaks of Structure (BoS) in price action, helping traders quickly identify when the market transitions from one structural phase to another.
A Break of Structure occurs when price moves beyond a previous swing high or swing low, signaling that the current trend may be continuing or shifting. These moments are often where momentum accelerates as liquidity is taken and market participants reposition.
This indicator removes the need to manually track swing points by automatically identifying key structure levels and highlighting when they are broken.
By clearly marking these structural events, traders can better understand trend continuation, potential reversals, and areas where liquidity has likely been taken.
█ FEATURES
Automatic Structure Detection
Identifies important swing highs and lows to define the current market structure.
Break of Structure Signals (BoS)
Highlights when price breaks a previously established structural level.
Bullish & Bearish Structure Breaks
Clearly distinguishes between bullish and bearish structural shifts.
Clean Chart Visualization
Designed to provide clear structural insights without cluttering your chart.
Works Across All Markets & Timeframes
Suitable for Forex, Crypto, Stocks, and Futures on any timeframe.
█ HOW TO USE
Trend Confirmation
A bullish break of structure suggests buyers are in control and the trend may continue upward.
A bearish break of structure suggests sellers are dominating the market.
Continuation Trades
Traders often use BOS signals to confirm that a trend remains intact before entering pullback trades.
Liquidity & Momentum Awareness
Structure breaks frequently occur when liquidity above highs or below lows is taken. This can lead to rapid price movement.
Combine With Other Tools
For best results, use structural breaks alongside other concepts such as:
█ WHY MARKET STRUCTURE MATTERS
Markets move in cycles of accumulation, expansion, retracement, and continuation.
Breaks of structure are often the first sign that the next phase has begun.
By identifying these key moments automatically, Core Structure Break helps traders stay aligned with the underlying market structure instead of reacting emotionally to every price movement.
Core Structure Break is designed to automatically detect Breaks of Structure (BoS) in price action, helping traders quickly identify when the market transitions from one structural phase to another.
A Break of Structure occurs when price moves beyond a previous swing high or swing low, signaling that the current trend may be continuing or shifting. These moments are often where momentum accelerates as liquidity is taken and market participants reposition.
This indicator removes the need to manually track swing points by automatically identifying key structure levels and highlighting when they are broken.
By clearly marking these structural events, traders can better understand trend continuation, potential reversals, and areas where liquidity has likely been taken.
█ FEATURES
Automatic Structure Detection
Identifies important swing highs and lows to define the current market structure.
Break of Structure Signals (BoS)
Highlights when price breaks a previously established structural level.
Bullish & Bearish Structure Breaks
Clearly distinguishes between bullish and bearish structural shifts.
Clean Chart Visualization
Designed to provide clear structural insights without cluttering your chart.
Works Across All Markets & Timeframes
Suitable for Forex, Crypto, Stocks, and Futures on any timeframe.
█ HOW TO USE
Trend Confirmation
A bullish break of structure suggests buyers are in control and the trend may continue upward.
A bearish break of structure suggests sellers are dominating the market.
Continuation Trades
Traders often use BOS signals to confirm that a trend remains intact before entering pullback trades.
Liquidity & Momentum Awareness
Structure breaks frequently occur when liquidity above highs or below lows is taken. This can lead to rapid price movement.
Combine With Other Tools
For best results, use structural breaks alongside other concepts such as:
- Support & Resistance
- Liquidity Sweeps
- Order Blocks
- Fair Value Gaps
- Trend Indicators
█ WHY MARKET STRUCTURE MATTERS
Markets move in cycles of accumulation, expansion, retracement, and continuation.
Breaks of structure are often the first sign that the next phase has begun.
By identifying these key moments automatically, Core Structure Break helps traders stay aligned with the underlying market structure instead of reacting emotionally to every price movement.
發行說明
Add 'Max Display' to allow customization of number of BoS to display.開源腳本
秉持TradingView一貫精神,這個腳本的創作者將其設為開源,以便交易者檢視並驗證其功能。向作者致敬!您可以免費使用此腳本,但請注意,重新發佈代碼需遵守我們的社群規範。

免責聲明
這些資訊和出版物並非旨在提供,也不構成TradingView提供或認可的任何形式的財務、投資、交易或其他類型的建議或推薦。請閱讀使用條款以了解更多資訊。
免責聲明
這些資訊和出版物並非旨在提供,也不構成TradingView提供或認可的任何形式的財務、投資、交易或其他類型的建議或推薦。請閱讀使用條款以了解更多資訊。