CRT with Trend Filter
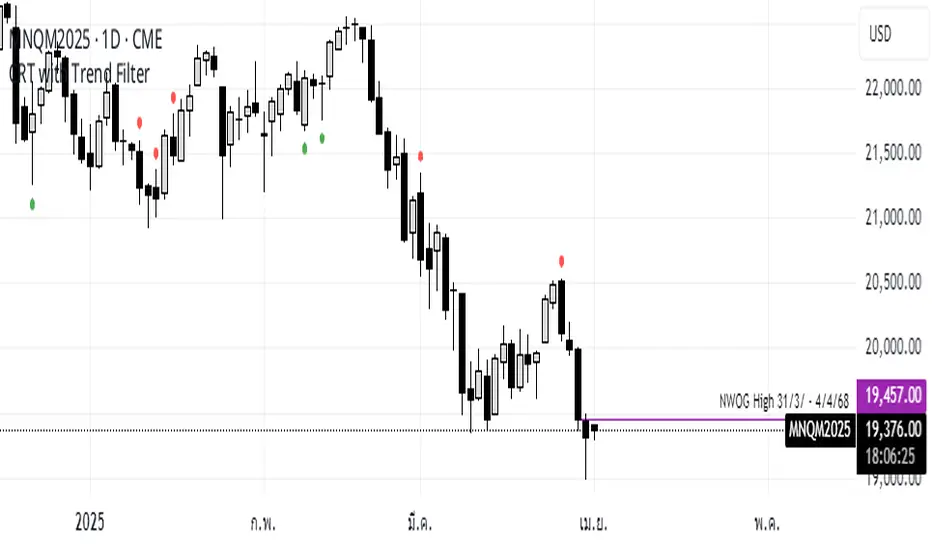
Explanation of Functionality
The CRT RED DOG with Trend Filter indicator is a tool used to identify buy and sell signals on a price chart. It filters signals based on the market trend to ensure higher accuracy.
Main Components of the Indicator
Moving Average (EMA) Settings
Users can set the moving average (EMA) length as desired, with a default value of 50 days.
This moving average is used to determine the market trend.
Determining Market Trend
Uptrend: Occurs when the closing price is above the moving average.
Downtrend: Occurs when the closing price is below the moving average.
Identifying Buy and Sell Signals
Buy Signal: Occurs when the current bar's low is lower than the previous bar's low, and the closing price is higher than the previous bar's close, during an uptrend.
Sell Signal: Occurs when the current bar's high is higher than the previous bar's high, and the closing price is lower than the previous bar's close, during a downtrend.
Displaying Signals on the Chart
Buy signals are displayed with a green arrow below the candlestick.
Sell signals are displayed with a red arrow above the candlestick.
Time frame Day >> 15M

免責聲明
這些資訊和出版物並非旨在提供,也不構成TradingView提供或認可的任何形式的財務、投資、交易或其他類型的建議或推薦。請閱讀使用條款以了解更多資訊。
免責聲明
這些資訊和出版物並非旨在提供,也不構成TradingView提供或認可的任何形式的財務、投資、交易或其他類型的建議或推薦。請閱讀使用條款以了解更多資訊。