OPEN-SOURCE SCRIPT
Advanced Multi-RSI Momentum System
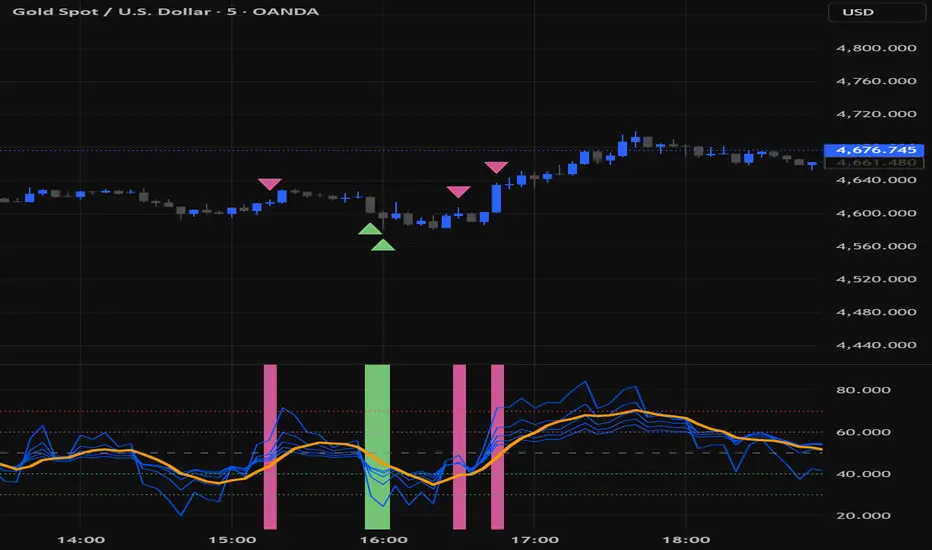
Advanced Multi-RSI Momentum System
This indicator is an enhanced version of multi-timeframe RSI analysis that combines five different RSI periods (7, 14, 21, 28, 35) with a Zero-Lag EMA to create a more responsive and reliable momentum oscillator.
What makes it different:
- Uses a weighted combination of multiple RSI lengths to reduce false signals common in single RSI indicators.
- Zero-Lag smoothing on the average RSI for faster reaction to momentum shifts.
- Intelligent color-coded background system that clearly shows:
• Early momentum signals
• Confirmation signals
• Momentum fading zones
• Consolidation phases (potential breakout setups)
- Clean triangle markers placed directly on the price chart for quick visual reference of buy and sell zones.
How it works:
The script calculates five RSIs with different sensitivities, takes their average, applies Zero-Lag EMA, and then uses specific crossover logic between the RSIs to detect shifts in momentum strength. Consolidation is detected by analyzing both price range and RSI range simultaneously.
Best used on 1H and 4H timeframes for swing and intraday trading.
All colors are fully customizable.
This is not just another RSI indicator — it's a complete momentum analysis system designed to help traders spot high-probability entries, exits, and consolidation breakouts with greater clarity.
Haschemi
This indicator is an enhanced version of multi-timeframe RSI analysis that combines five different RSI periods (7, 14, 21, 28, 35) with a Zero-Lag EMA to create a more responsive and reliable momentum oscillator.
What makes it different:
- Uses a weighted combination of multiple RSI lengths to reduce false signals common in single RSI indicators.
- Zero-Lag smoothing on the average RSI for faster reaction to momentum shifts.
- Intelligent color-coded background system that clearly shows:
• Early momentum signals
• Confirmation signals
• Momentum fading zones
• Consolidation phases (potential breakout setups)
- Clean triangle markers placed directly on the price chart for quick visual reference of buy and sell zones.
How it works:
The script calculates five RSIs with different sensitivities, takes their average, applies Zero-Lag EMA, and then uses specific crossover logic between the RSIs to detect shifts in momentum strength. Consolidation is detected by analyzing both price range and RSI range simultaneously.
Best used on 1H and 4H timeframes for swing and intraday trading.
All colors are fully customizable.
This is not just another RSI indicator — it's a complete momentum analysis system designed to help traders spot high-probability entries, exits, and consolidation breakouts with greater clarity.
Haschemi
開源腳本
秉持TradingView一貫精神,這個腳本的創作者將其設為開源,以便交易者檢視並驗證其功能。向作者致敬!您可以免費使用此腳本,但請注意,重新發佈代碼需遵守我們的社群規範。

免責聲明
這些資訊和出版物並非旨在提供,也不構成TradingView提供或認可的任何形式的財務、投資、交易或其他類型的建議或推薦。請閱讀使用條款以了解更多資訊。
開源腳本
秉持TradingView一貫精神,這個腳本的創作者將其設為開源,以便交易者檢視並驗證其功能。向作者致敬!您可以免費使用此腳本,但請注意,重新發佈代碼需遵守我們的社群規範。
免責聲明
這些資訊和出版物並非旨在提供,也不構成TradingView提供或認可的任何形式的財務、投資、交易或其他類型的建議或推薦。請閱讀使用條款以了解更多資訊。