OPEN-SOURCE SCRIPT
已更新 EMA Pro+ Suite
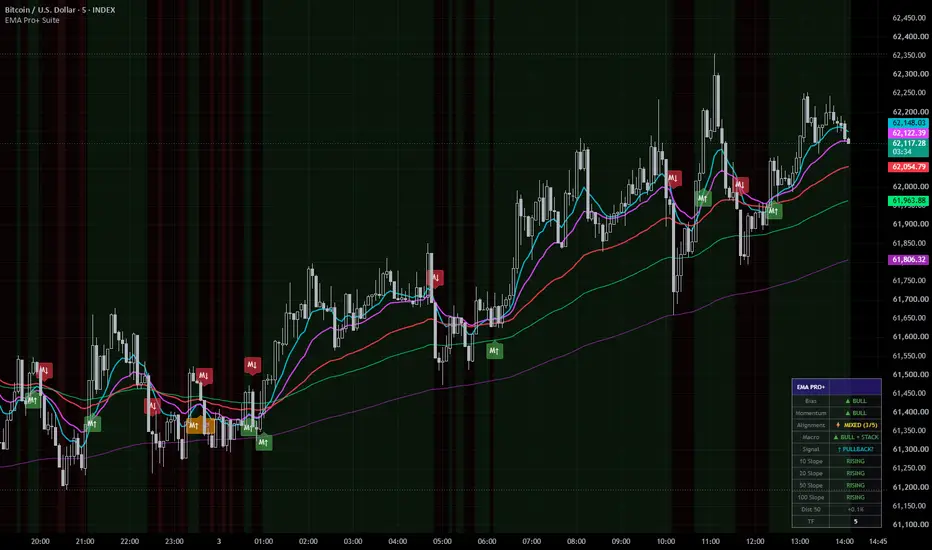
# EMA Pro+ Suite
**A multi-layer EMA confluence framework for reading market state at a glance.**
---
## What It Is
EMA Pro+ Suite is an overlay indicator built around three exponential moving averages — a Fast (10), Mid (20), and Slow (50) EMA — organized into a structured three-layer state engine that tells you the current market regime, momentum direction, and whether price is in or out of alignment with that regime. Rather than treating each EMA in isolation, the suite reads them together as a system and surfaces a single, coherent market state at all times.
A corner dashboard table updates in real time, giving you an instant read on bias, momentum, alignment, EMA slopes, and price extension — without having to scan the chart manually.
---
## How It Works
The indicator evaluates three distinct layers on every bar:
**Layer 1 — Bias (Trend Regime)**
Defined by price relative to the 50 EMA. Price above = bullish bias. Price below = bearish bias. This is the macro filter — it determines which direction setups should be taken in.
**Layer 2 — Momentum**
Defined by the 10 EMA relative to the 20 EMA. When the fast EMA is above the mid EMA, momentum is bullish. When below, momentum is bearish. Momentum alignment with bias is the confirmation layer.
**Layer 3 — Price vs Fast EMA**
When bias and momentum are aligned but price is on the wrong side of the 10 EMA, the indicator flags a potential pullback or exhaustion condition. In a full bull regime, price dipping below the 10 EMA may represent a high-quality entry opportunity — or an early warning of trend exhaustion. Context determines which.
**Slope Engine**
Each EMA is evaluated for slope using a configurable lookback. RISING / FLAT / FALLING is displayed per EMA in the dashboard. A momentum flip on flat EMAs carries significantly less weight than one on rising or falling EMAs — this is critical for filtering out noise in ranging conditions.
**Price Distance from 50 EMA**
Tracks how extended price is from the slow EMA as a percentage. Large positive or negative readings flag mean reversion risk.
**Bar & Background Coloring**
- Green background + green bars = full bull alignment
- Red background + red bars = full bear alignment
- Yellow bars = conflicting bias and momentum (mixed / transitional state)
- Aqua bars = bull regime, price pulling back below 10 EMA
- Fuchsia bars = bear regime, price popping above 10 EMA
**Cross Signals**
- `M↑` (green) — 10 EMA crossed above 20 EMA in bull zone. Aligned, higher conviction.
- `M↓` (red) — 10 EMA crossed below 20 EMA in bear zone. Aligned, higher conviction.
- `M↑ 🐻` (orange) — Bullish momentum flip firing in bear zone. Counter-trend, lower conviction.
- `M↓ 🐂` (orange) — Bearish momentum flip firing in bull zone. Counter-trend, lower conviction.
**Multi-Timeframe Support**
All three EMAs can be calculated on a higher timeframe and plotted on the current chart. Use this to anchor your bias to the HTF structure while reading entries on a lower timeframe.
---
## Possible Ways to Use It
**Trend Following**
Wait for full alignment — green background, green bars, all three slopes RISING. Only look for long entries. Use the 10 EMA pullback (aqua bars) as a potential entry trigger. Reverse logic for shorts.
**Momentum Flip Entries**
Use aligned `M↑` / `M↓` signals (green/red) as entry triggers when bias and slope confirm. Discard or fade counter-trend orange signals unless you have a specific reason to trade against the regime.
**Regime Filter for Other Systems**
Use the bias layer (price vs 50 EMA) as a filter for another strategy. Only take long signals from your primary system when EMA Pro+ shows bull bias, and vice versa.
**HTF Confluence**
Set the EMA Timeframe to a higher timeframe (e.g. 4H or Daily) while trading on a 15m or 1H chart. The dashboard will show the HTF regime, giving you a structural anchor for your intraday reads.
**Avoiding Chop**
When all three slopes read FLAT and bars are yellow (mixed alignment), the market is in a transitional or ranging state. Consider standing aside or reducing position size until a clear regime re-establishes.
**Mean Reversion Awareness**
When Dist 50 shows a large positive or negative reading, price is extended from the slow EMA. In trending markets this can persist — but it raises the bar for adding to positions and flags potential snapback risk.
---
## Settings
| Setting | Description |
|---|---|
| EMA Timeframe | Blank = current chart timeframe. Enter any TF (e.g. 60, 240, D) for MTF mode. |
| Fast / Mid / Slow EMA Length | Default 10 / 20 / 50. Fully adjustable. |
| Slope Lookback | Number of bars used to calculate EMA slope. Increase on lower timeframes to reduce flat readings. |
| Show EMA Lines | Toggle the three EMA plots. |
| Show Bias Background | Toggle the green/red background tint. |
| Color Bars by State | Toggle bar coloring. |
| Show Cross Signals | Toggle M↑ / M↓ labels on chart. |
| Show Dashboard Table | Toggle the corner HUD. |
| Table Position | Top Right / Top Left / Bottom Right / Bottom Left. |
| Bar Close Reminder Alert | Fires a reminder alert on every bar close to check the setup. |
---
## Alerts
- Momentum Flip Bullish — Bull Zone (aligned)
- Momentum Flip Bullish — Bear Zone (counter-trend)
- Momentum Flip Bearish — Bear Zone (aligned)
- Momentum Flip Bearish — Bull Zone (counter-trend)
- Price Reclaimed 50 EMA (bias flipped bullish)
- Price Lost 50 EMA (bias flipped bearish)
- Bull Pullback Signal (bull regime, price below 10 EMA)
- Bear Pullback Signal (bear regime, price above 10 EMA)
- Bar Close Reminder
---
## Disclaimer
This indicator is provided for educational and informational purposes only. It does not constitute financial advice, investment advice, or a recommendation to buy or sell any asset. All trading involves substantial risk of loss. Past performance of any signal, strategy, or system is not indicative of future results.
EMA Pro+ Suite is a tool to assist with technical analysis — it does not predict price, guarantee accuracy, or remove the inherent uncertainty of financial markets. No indicator eliminates risk. You are solely responsible for your own trading decisions.
Always conduct your own research, apply proper risk management, and consider consulting a licensed financial professional before making any trading decisions. Only trade with capital you can afford to lose.
**A multi-layer EMA confluence framework for reading market state at a glance.**
---
## What It Is
EMA Pro+ Suite is an overlay indicator built around three exponential moving averages — a Fast (10), Mid (20), and Slow (50) EMA — organized into a structured three-layer state engine that tells you the current market regime, momentum direction, and whether price is in or out of alignment with that regime. Rather than treating each EMA in isolation, the suite reads them together as a system and surfaces a single, coherent market state at all times.
A corner dashboard table updates in real time, giving you an instant read on bias, momentum, alignment, EMA slopes, and price extension — without having to scan the chart manually.
---
## How It Works
The indicator evaluates three distinct layers on every bar:
**Layer 1 — Bias (Trend Regime)**
Defined by price relative to the 50 EMA. Price above = bullish bias. Price below = bearish bias. This is the macro filter — it determines which direction setups should be taken in.
**Layer 2 — Momentum**
Defined by the 10 EMA relative to the 20 EMA. When the fast EMA is above the mid EMA, momentum is bullish. When below, momentum is bearish. Momentum alignment with bias is the confirmation layer.
**Layer 3 — Price vs Fast EMA**
When bias and momentum are aligned but price is on the wrong side of the 10 EMA, the indicator flags a potential pullback or exhaustion condition. In a full bull regime, price dipping below the 10 EMA may represent a high-quality entry opportunity — or an early warning of trend exhaustion. Context determines which.
**Slope Engine**
Each EMA is evaluated for slope using a configurable lookback. RISING / FLAT / FALLING is displayed per EMA in the dashboard. A momentum flip on flat EMAs carries significantly less weight than one on rising or falling EMAs — this is critical for filtering out noise in ranging conditions.
**Price Distance from 50 EMA**
Tracks how extended price is from the slow EMA as a percentage. Large positive or negative readings flag mean reversion risk.
**Bar & Background Coloring**
- Green background + green bars = full bull alignment
- Red background + red bars = full bear alignment
- Yellow bars = conflicting bias and momentum (mixed / transitional state)
- Aqua bars = bull regime, price pulling back below 10 EMA
- Fuchsia bars = bear regime, price popping above 10 EMA
**Cross Signals**
- `M↑` (green) — 10 EMA crossed above 20 EMA in bull zone. Aligned, higher conviction.
- `M↓` (red) — 10 EMA crossed below 20 EMA in bear zone. Aligned, higher conviction.
- `M↑ 🐻` (orange) — Bullish momentum flip firing in bear zone. Counter-trend, lower conviction.
- `M↓ 🐂` (orange) — Bearish momentum flip firing in bull zone. Counter-trend, lower conviction.
**Multi-Timeframe Support**
All three EMAs can be calculated on a higher timeframe and plotted on the current chart. Use this to anchor your bias to the HTF structure while reading entries on a lower timeframe.
---
## Possible Ways to Use It
**Trend Following**
Wait for full alignment — green background, green bars, all three slopes RISING. Only look for long entries. Use the 10 EMA pullback (aqua bars) as a potential entry trigger. Reverse logic for shorts.
**Momentum Flip Entries**
Use aligned `M↑` / `M↓` signals (green/red) as entry triggers when bias and slope confirm. Discard or fade counter-trend orange signals unless you have a specific reason to trade against the regime.
**Regime Filter for Other Systems**
Use the bias layer (price vs 50 EMA) as a filter for another strategy. Only take long signals from your primary system when EMA Pro+ shows bull bias, and vice versa.
**HTF Confluence**
Set the EMA Timeframe to a higher timeframe (e.g. 4H or Daily) while trading on a 15m or 1H chart. The dashboard will show the HTF regime, giving you a structural anchor for your intraday reads.
**Avoiding Chop**
When all three slopes read FLAT and bars are yellow (mixed alignment), the market is in a transitional or ranging state. Consider standing aside or reducing position size until a clear regime re-establishes.
**Mean Reversion Awareness**
When Dist 50 shows a large positive or negative reading, price is extended from the slow EMA. In trending markets this can persist — but it raises the bar for adding to positions and flags potential snapback risk.
---
## Settings
| Setting | Description |
|---|---|
| EMA Timeframe | Blank = current chart timeframe. Enter any TF (e.g. 60, 240, D) for MTF mode. |
| Fast / Mid / Slow EMA Length | Default 10 / 20 / 50. Fully adjustable. |
| Slope Lookback | Number of bars used to calculate EMA slope. Increase on lower timeframes to reduce flat readings. |
| Show EMA Lines | Toggle the three EMA plots. |
| Show Bias Background | Toggle the green/red background tint. |
| Color Bars by State | Toggle bar coloring. |
| Show Cross Signals | Toggle M↑ / M↓ labels on chart. |
| Show Dashboard Table | Toggle the corner HUD. |
| Table Position | Top Right / Top Left / Bottom Right / Bottom Left. |
| Bar Close Reminder Alert | Fires a reminder alert on every bar close to check the setup. |
---
## Alerts
- Momentum Flip Bullish — Bull Zone (aligned)
- Momentum Flip Bullish — Bear Zone (counter-trend)
- Momentum Flip Bearish — Bear Zone (aligned)
- Momentum Flip Bearish — Bull Zone (counter-trend)
- Price Reclaimed 50 EMA (bias flipped bullish)
- Price Lost 50 EMA (bias flipped bearish)
- Bull Pullback Signal (bull regime, price below 10 EMA)
- Bear Pullback Signal (bear regime, price above 10 EMA)
- Bar Close Reminder
---
## Disclaimer
This indicator is provided for educational and informational purposes only. It does not constitute financial advice, investment advice, or a recommendation to buy or sell any asset. All trading involves substantial risk of loss. Past performance of any signal, strategy, or system is not indicative of future results.
EMA Pro+ Suite is a tool to assist with technical analysis — it does not predict price, guarantee accuracy, or remove the inherent uncertainty of financial markets. No indicator eliminates risk. You are solely responsible for your own trading decisions.
Always conduct your own research, apply proper risk management, and consider consulting a licensed financial professional before making any trading decisions. Only trade with capital you can afford to lose.
發行說明
UPDATE: Macro Integration & Conviction TieringThis update evolves the EMA Pro+ Suite into a high-conviction framework by layering in Macro EMAs (100 & 200). The system no longer just looks at momentum; it now evaluates whether that momentum is firing into a "Full Stack" structural trend or struggling against long-term macro resistance.
Key Macro Additions
The Bull Score (0–5 Tiering)
Instead of a simple "Bull or Bear" binary, the engine now calculates a Conviction Score based on price positioning relative to all five EMAs.
Score 5: Ultra-high conviction. Price is above all five EMAs (10, 20, 50, 100, 200).
Score 3-2: Transitional/Mixed. Price is between the fast momentum lines and the macro structural lines.
Score 0: Ultra-high bear conviction. Price is below every EMA in the stack.
Macro Background Logic
The background tint is now intensity-aware. When the local bias (50 EMA) aligns with the Macro trend (100/200), the background is deeper and more prominent. When the bias is fighting the macro trend, the tint fades, signaling a "lower conviction" environment where traders should exercise caution.
Macro Structure Dashboard Row
A new row in the HUD tracks Structural Confluence. It doesn't just check if price is above the 200 EMA; it checks for the EMA Stack (100 above/below 200). A "BULL + STACK" reading tells you the long-term trend is both positive and accelerating in the right order.
Revised How It Works
Layer 1 — Core Bias (50 EMA)
The baseline for local trend direction.
Layer 2 — Macro Structure (100 & 200 EMAs)
The "Big Picture" filter. This layer identifies major support/resistance floors.
Layer 3 — Momentum (10/20 Crosses)
Short-term momentum flips. These signals are now weighted by the Bull Score. A momentum flip occurring at a Bull Score of 4 or 5 is a much higher probability event than one firing at a Score of 1 or 2.
Bar Color (Conviction Heatmap)
Bar colors now reflect the Bull Score intensity:
* Bright Green/Red: Full trend/macro alignment (5/5 or 0/5).
* Subdued Green/Red: Trend alignment but lacking macro confirmation.
* Yellow: True neutral—price trapped within the EMA stack.
New Strategies with Macro Context
Macro "Mean Reversion" Entry
In a structural bull trend (Macro: BULL + STACK), look for pullback signals (Aqua bars) that occur as price tests the 100 or 200 EMA. These macro-bounce zones often represent the highest "Risk-to-Reward" entries in the system.
Early Trend Detection
Watch for the Macro Golden Cross (100 crossing 200). When this fires while the Dashboard shows a Bull Score of 4 or 5, it signals the transition from a local rally to a sustainable long-term trend.
Updated Settings & Alerts
New Setting // Description
Macro EMA Lengths //Default 100 / 200. Defines the structural floor.
Show Macro EMA Lines //Toggle visibility of the long-term structural lines.
New Macro Alerts:
* Price Reclaimed/Lost 200 EMA: Alerts you when a major "line in the sand" is crossed.
* Macro Golden/Death Cross: Notifies you of long-term structural shifts (100/200 cross).
Summary of Dashboard UI Changes
* Alignment: Upgraded to show the X/5 Bull Score and color-coded conviction.
* Macro: New row tracking structural bias and stack health.
* 100 Slope: Added to the slope stack to monitor long-term trend acceleration.
開源腳本
秉持TradingView一貫精神,這個腳本的創作者將其設為開源,以便交易者檢視並驗證其功能。向作者致敬!您可以免費使用此腳本,但請注意,重新發佈代碼需遵守我們的社群規範。

免責聲明
這些資訊和出版物並非旨在提供,也不構成TradingView提供或認可的任何形式的財務、投資、交易或其他類型的建議或推薦。請閱讀使用條款以了解更多資訊。
免責聲明
這些資訊和出版物並非旨在提供,也不構成TradingView提供或認可的任何形式的財務、投資、交易或其他類型的建議或推薦。請閱讀使用條款以了解更多資訊。