OPEN-SOURCE SCRIPT
[Kpt-Ahab] HeatMap Fusion
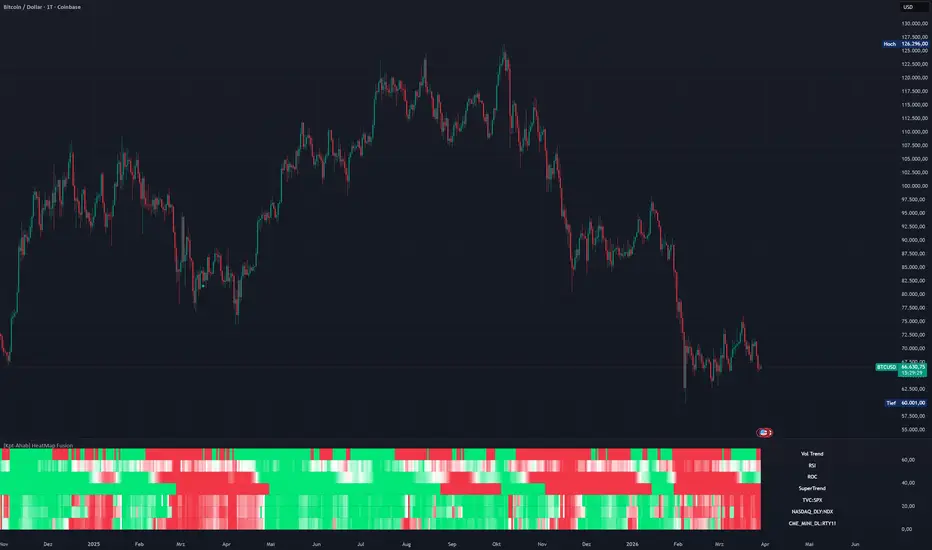
What is “HeatMap Fusion”?
HeatMap Fusion merges RSI, Volume Trend, ROC and an enhanced SuperTrend into one stacked heat-map. Smooth colour gradients reveal—at a glance—whether each component is bullish, neutral, or bearish, without cluttering the chart with multiple separate panes.
Key Features
Multi-indicator heat-map
Three symbols with volume- or price-based colouring.
RSI, ROC and SuperTrend share the same colour scale → instant market-breadth read-out.
View switcher – choose RSI, ROC, SuperTrend, Volume SMA, Up/Down Volume or ALL from a single dropdown.
Six colour schemes (red⇅green, purple⇅blue, etc.) for both light and dark layouts.
Optional RSI divergence detection.
Heikin-Ashi–driven SuperTrend plus Rapid Volatility Trend lines.
Performance-optimised – only three request.security() calls for the selected symbols.
Inputs
Group Core settings
Indicator Layer to display
Color Scheme (Heatmap) 6 presets
Symbol 3 tickers, volume/price mode, look-back length
RSI Period, MA type, BB width, divergence flag
Volume Trend SMA length, up/down columns
ROC Period & intensity threshold
SuperTrend Two ATR sets, Heikin-Ashi on/off
(Every parameter is commented inside the script.)
How to Use
Add the script to any chart.
Set SymCal to on when your symbol has real volume data (futures, ETFs, equities).
Replace the three default tickers with your own—e.g. ES1!, ZB1!, CL1! for a macro setup.
Pick a colour scheme; Purple ⇅ Blue looks great on dark backgrounds.
Choose ALL for the full heat-map with labels, or isolate any single layer via the dropdown.
Notes
The heat-map lives in the main pane on fixed Y-bands (0 – 70). Do not enable Auto-Fit scaling.
If a symbol has no volume, SymCal = on yields no colouring—switch it off to fall back to price-based gradients.
HeatMap Fusion merges RSI, Volume Trend, ROC and an enhanced SuperTrend into one stacked heat-map. Smooth colour gradients reveal—at a glance—whether each component is bullish, neutral, or bearish, without cluttering the chart with multiple separate panes.
Key Features
Multi-indicator heat-map
Three symbols with volume- or price-based colouring.
RSI, ROC and SuperTrend share the same colour scale → instant market-breadth read-out.
View switcher – choose RSI, ROC, SuperTrend, Volume SMA, Up/Down Volume or ALL from a single dropdown.
Six colour schemes (red⇅green, purple⇅blue, etc.) for both light and dark layouts.
Optional RSI divergence detection.
Heikin-Ashi–driven SuperTrend plus Rapid Volatility Trend lines.
Performance-optimised – only three request.security() calls for the selected symbols.
Inputs
Group Core settings
Indicator Layer to display
Color Scheme (Heatmap) 6 presets
Symbol 3 tickers, volume/price mode, look-back length
RSI Period, MA type, BB width, divergence flag
Volume Trend SMA length, up/down columns
ROC Period & intensity threshold
SuperTrend Two ATR sets, Heikin-Ashi on/off
(Every parameter is commented inside the script.)
How to Use
Add the script to any chart.
Set SymCal to on when your symbol has real volume data (futures, ETFs, equities).
Replace the three default tickers with your own—e.g. ES1!, ZB1!, CL1! for a macro setup.
Pick a colour scheme; Purple ⇅ Blue looks great on dark backgrounds.
Choose ALL for the full heat-map with labels, or isolate any single layer via the dropdown.
Notes
The heat-map lives in the main pane on fixed Y-bands (0 – 70). Do not enable Auto-Fit scaling.
If a symbol has no volume, SymCal = on yields no colouring—switch it off to fall back to price-based gradients.
開源腳本
秉持TradingView一貫精神,這個腳本的創作者將其設為開源,以便交易者檢視並驗證其功能。向作者致敬!您可以免費使用此腳本,但請注意,重新發佈代碼需遵守我們的社群規範。

免責聲明
這些資訊和出版物並非旨在提供,也不構成TradingView提供或認可的任何形式的財務、投資、交易或其他類型的建議或推薦。請閱讀使用條款以了解更多資訊。
免責聲明
這些資訊和出版物並非旨在提供,也不構成TradingView提供或認可的任何形式的財務、投資、交易或其他類型的建議或推薦。請閱讀使用條款以了解更多資訊。