OPEN-SOURCE SCRIPT
已更新 RSI Candlestick Chart
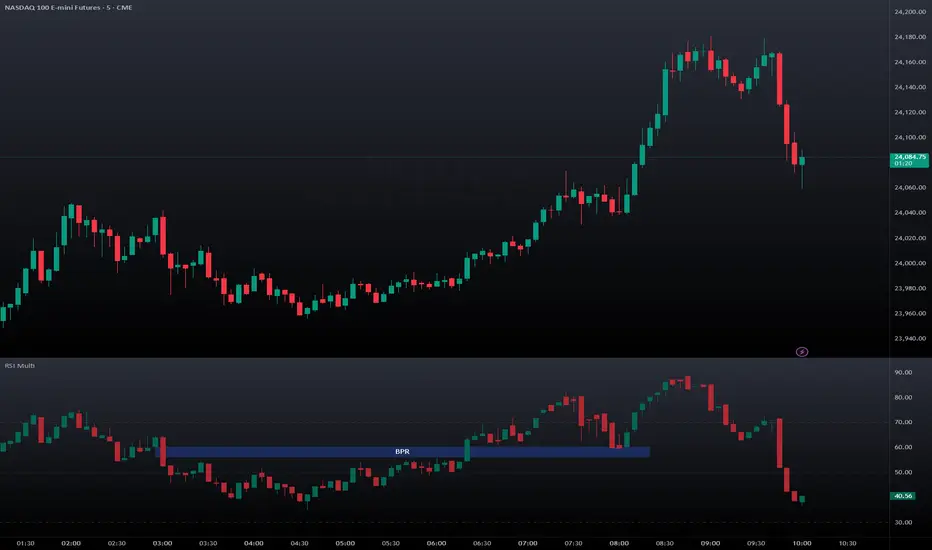
A simple and clean yet powerful RSI in candlestick version.
The concept is simple: just like a line chart hides from you a lot of information that candlestick chart can reveal, why not doing the same with RSI?
Now you can clearly see the wicks, patterns, structure at a single glance.
FVG, BPR, hammer, you name it.
The concept is simple: just like a line chart hides from you a lot of information that candlestick chart can reveal, why not doing the same with RSI?
Now you can clearly see the wicks, patterns, structure at a single glance.
FVG, BPR, hammer, you name it.
發行說明
The new updated version adds the possibility to switch to Heiken Ashi or back to line chart if needed. Also updated it to V6 while at it. 發行說明
small update to restore the proper chart style開源腳本
秉持TradingView一貫精神,這個腳本的創作者將其設為開源,以便交易者檢視並驗證其功能。向作者致敬!您可以免費使用此腳本,但請注意,重新發佈代碼需遵守我們的社群規範。

免責聲明
這些資訊和出版物並非旨在提供,也不構成TradingView提供或認可的任何形式的財務、投資、交易或其他類型的建議或推薦。請閱讀使用條款以了解更多資訊。
開源腳本
秉持TradingView一貫精神,這個腳本的創作者將其設為開源,以便交易者檢視並驗證其功能。向作者致敬!您可以免費使用此腳本,但請注意,重新發佈代碼需遵守我們的社群規範。
免責聲明
這些資訊和出版物並非旨在提供,也不構成TradingView提供或認可的任何形式的財務、投資、交易或其他類型的建議或推薦。請閱讀使用條款以了解更多資訊。