OPEN-SOURCE SCRIPT
FVG & iFVG (Yair_Misgav)
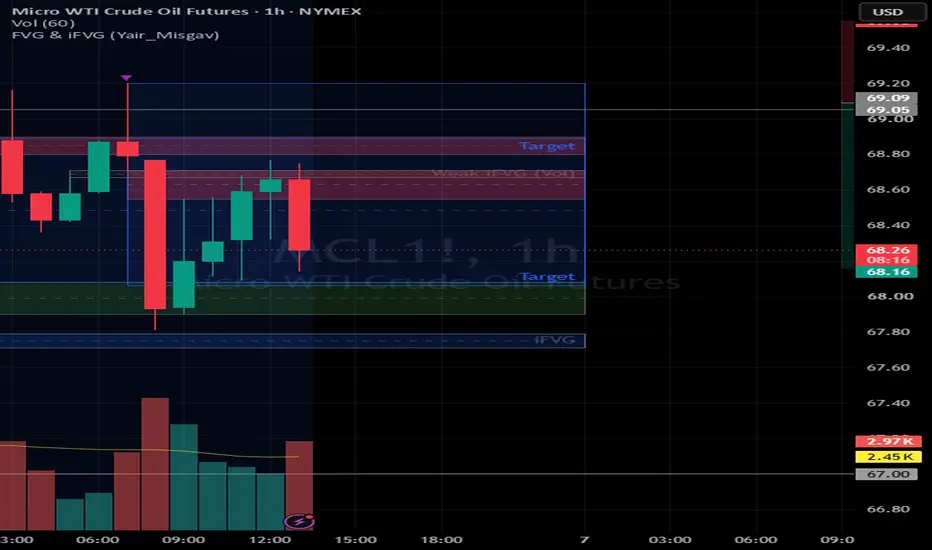
This indicator provides automated identification, filtering, and management of Fair Value Gaps (FVG) and Inversion Fair Value Gaps (iFVG). It is designed for traders utilizing Smart Money Concepts (SMC) who require a systematic approach to identifying liquidity and structural imbalances.
Key Technical Features:
Algorithmic Detection: Identifies gaps in price action based on structural imbalances, with integrated filters for Volume SMA and Body-to-Range ratios to ensure only high-momentum zones are prioritized.
Dynamic Inversion Engine: Automatically transitions identified FVGs into iFVGs once price penetrates the zone, reclassifying support-turned-resistance (or vice versa) to maintain structural accuracy.
Symmetrical Projection (Measured Move): Calculates and projects target zones based on the structural swing origin. This feature includes an optional midline toggle for precise assessment of potential profit targets or reversal areas.
Configurable Visualization: Offers dual extension modes (Fixed vs. Dynamic to Last Bar) and customizable lookback periods to manage chart density and historical tracking.
Visual Logic: Provides clear, configurable styling options for borders, midlines, and labeling, allowing for seamless integration into existing technical chart setups.
Note: This tool is intended for structural analysis and should be used in conjunction with a robust risk management strategy.
Key Technical Features:
Algorithmic Detection: Identifies gaps in price action based on structural imbalances, with integrated filters for Volume SMA and Body-to-Range ratios to ensure only high-momentum zones are prioritized.
Dynamic Inversion Engine: Automatically transitions identified FVGs into iFVGs once price penetrates the zone, reclassifying support-turned-resistance (or vice versa) to maintain structural accuracy.
Symmetrical Projection (Measured Move): Calculates and projects target zones based on the structural swing origin. This feature includes an optional midline toggle for precise assessment of potential profit targets or reversal areas.
Configurable Visualization: Offers dual extension modes (Fixed vs. Dynamic to Last Bar) and customizable lookback periods to manage chart density and historical tracking.
Visual Logic: Provides clear, configurable styling options for borders, midlines, and labeling, allowing for seamless integration into existing technical chart setups.
Note: This tool is intended for structural analysis and should be used in conjunction with a robust risk management strategy.
開源腳本
秉持TradingView一貫精神,這個腳本的創作者將其設為開源,以便交易者檢視並驗證其功能。向作者致敬!您可以免費使用此腳本,但請注意,重新發佈代碼需遵守我們的社群規範。

免責聲明
這些資訊和出版物並非旨在提供,也不構成TradingView提供或認可的任何形式的財務、投資、交易或其他類型的建議或推薦。請閱讀使用條款以了解更多資訊。
開源腳本
秉持TradingView一貫精神,這個腳本的創作者將其設為開源,以便交易者檢視並驗證其功能。向作者致敬!您可以免費使用此腳本,但請注意,重新發佈代碼需遵守我們的社群規範。
免責聲明
這些資訊和出版物並非旨在提供,也不構成TradingView提供或認可的任何形式的財務、投資、交易或其他類型的建議或推薦。請閱讀使用條款以了解更多資訊。