已更新
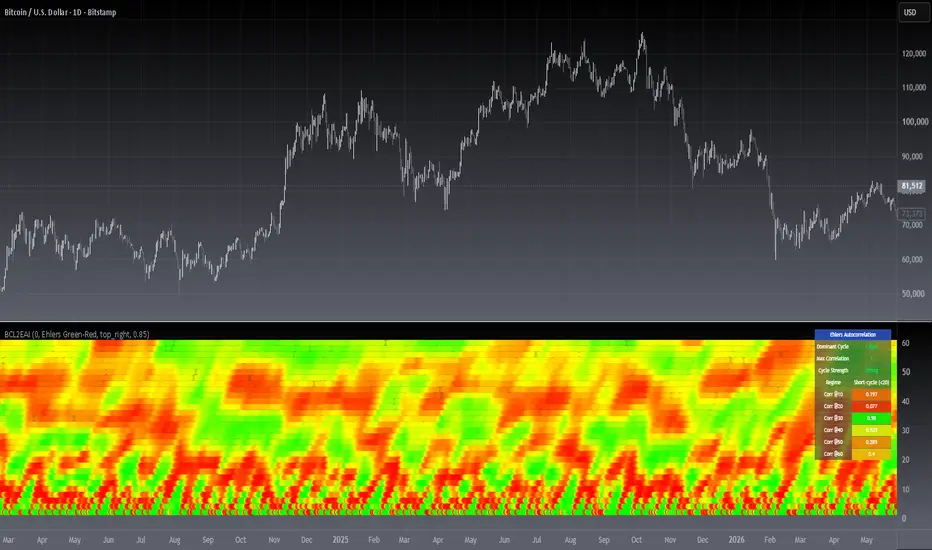
[blackcat] L2 Ehlers Autocorrelation Indicator
Level: 2
Background
John F. Ehlers introduced Autocorrelation Indicator in his "Cycle Analytics for Traders" chapter 8 on 2013.
Function
If we correlate a waveform composed of perfectly random numbers by itself, the correlation will be perfect. However, if we lag one of the data streams by just one bar, the correlation will be dramatically reduced. In a long memory process with normally distributed random numbers the autocorrelation follows the power law.
One of the underlying principles of technical analysis is that market data do not follow this power law of an efficient market, and we therefore can extract information from the partial correlation of the autocorrelation function. For example, assume the data being examined is a perfect sine wave whose period is 20 bars. The autocorrelation with zero lag, averaged over one full period of the sine wave, is unity. That is, the correlation is perfect. Introducing a lag of one bar in the autocorrelation process causes the average correlation to be decreased slightly. Introducing another bar of lag further decreases the average correlation, and so on. That is, until a lag of 10 bars is reached. In this case, the positive alternation of the sine wave is correlated with the negative alternation of the lagged waveform and the negative alternation of the sine wave is correlated with the positive alternation of the lagged waveform, with the result that perfect anticorrelation has been reached. Continued lag increases causes the average correlation to increase until a lag of 20 bars is reached. When the lag is equal to the period of the sine wave waveform, the correlation is again perfect. In this theoretical example, the correlation values as a function of lag vary exactly as a sine wave.
Market data are considerably messier than purely random numbers or perfect sine waves but contain features of both. However, the characteristics that are uncovered by autocorrelation offer unique trading perspectives. Aside from appearing psychedelic, there are two distinct characteristics of the autocorrelation indicator using minimum averaging. First, there is a sharp reversal from red to yellow and from yellow to red at the timing of price reversals for all periods of lag. Second, there is a variation of the thickness of the bars and the number of bars over the vertical range of the indicator as a function of time.
Key Signal
Corr --> Pearson correlation data array
Pros and Cons
I am sorry this script is NOT 100% as original Ehlers works but I modified it accordingly which demostrated with better visual effect.
Remarks
The 47th script for Blackcat1402 John F. Ehlers Week publication.
Courtesy of RicardoSantos for RGB functions.
Readme
In real life, I am a prolific inventor. I have successfully applied for more than 60 international and regional patents in the past 12 years. But in the past two years or so, I have tried to transfer my creativity to the development of trading strategies. Tradingview is the ideal platform for me. I am selecting and contributing some of the hundreds of scripts to publish in Tradingview community. Welcome everyone to interact with me to discuss these interesting pine scripts.
The scripts posted are categorized into 5 levels according to my efforts or manhours put into these works.
Level 1 : interesting script snippets or distinctive improvement from classic indicators or strategy. Level 1 scripts can usually appear in more complex indicators as a function module or element.
Level 2 : composite indicator/strategy. By selecting or combining several independent or dependent functions or sub indicators in proper way, the composite script exhibits a resonance phenomenon which can filter out noise or fake trading signal to enhance trading confidence level.
Level 3 : comprehensive indicator/strategy. They are simple trading systems based on my strategies. They are commonly containing several or all of entry signal, close signal, stop loss, take profit, re-entry, risk management, and position sizing techniques. Even some interesting fundamental and mass psychological aspects are incorporated.
Level 4 : script snippets or functions that do not disclose source code. Interesting element that can reveal market laws and work as raw material for indicators and strategies. If you find Level 1~2 scripts are helpful, Level 4 is a private version that took me far more efforts to develop.
Level 5 : indicator/strategy that do not disclose source code. private version of Level 3 script with my accumulated script processing skills or a large number of custom functions. I had a private function library built in past two years. Level 5 scripts use many of them to achieve private trading strategy.
發行說明
This version update makes tradeoffs between resolution and visual scope.發行說明
█ OVERVIEWThis indicator renders John Ehlers' Autocorrelation study as a live heatmap, measuring how strongly the dominant price cycle repeats at every lag from 1 to 60 bars. It helps you estimate the current dominant cycle period, judge cycle strength, and time tools that assume a market rhythm.
█ CONCEPTS
Price is first cleaned with a highpass filter (removes periods shorter than 48 bars), then smoothed with an Ehlers Super Smoother. For each lag, the Pearson correlation between the filtered series and itself shifted by that lag is computed and scaled to 0..1.
Key readings:
• Correlation near 1.0 at a given lag: price strongly repeats that pattern — that lag approximates the dominant cycle period in bars
• Correlation near 0.5: no meaningful repetition at that lag
• A bright horizontal band that persists = a stable cycle; a shifting band = cycle transition
█ HOW TO USE
1 — Add the indicator below your chart; each heatmap row is one even lag from 2 to 60 (y-axis value = lag in bars)
2 — Find the brightest green band; its y-value estimates the current dominant cycle period
3 — Read the dashboard for the exact dominant cycle, peak correlation, strength and regime
4 — Use the estimated period to tune other cycle-sensitive tools (e.g. set oscillator lengths near half the cycle period)
Input Parameters
• AvgLength: Pearson averaging window per lag; 0 = auto (window grows with lag, Ehlers default)
• Heatmap Theme: Ehlers Green-Red or Diverging Blue-Red palette
• Highlight dominant cycle row: full-opacity row marks the peak-lag estimate
• Show Status Dashboard / Dashboard Position: toggle and place the summary table
• Strong-cycle threshold: correlation level classifying a cycle as "Strong" (default 0.85)
█ FEATURES
• Even-lag 2-60 heatmap (30 rows) with two color themes; correlations for all lags 1-60 are still computed and summarized
• Dominant-cycle tracking with row highlighting on the heatmap
• Status dashboard: dominant cycle (bars), peak correlation, strength grade, regime classification (short / intermediate / long cycle), and color-coded correlation readings at lags 10/20/30/40/50/60
• Alerts: strong cycle detected, dominant-cycle regime change
█ IMPLEMENTATION NOTES
V2 improvements over the original release:
• Fixed a rescaling bias: when the correlation denominator degenerated (early bars or flat windows), stale values were re-scaled toward 1.0, painting false "strong" cells; V2 now holds the neutral 0.5 and pins lag 0 to its true value of 1.0
• Replaced the legacy quantized RGB lookup (its green channel rendered incorrectly) with native color functions
• Constrained AvgLength to a valid range and upgraded deprecated input syntax to Pine v6
█ LIMITATIONS
• Cycles shorter than ~10 bars are attenuated by the smoothing chain; very long cycles beyond 60 bars are outside the measurable window
• Estimates need history: give the chart roughly 3x the cycle length in bars
• Cycle strength varies across assets and timeframes; discretionary confirmation is advised
• This is a research tool — it measures cyclic behavior and does not produce trade signals
█ NOTES
• Based on John F. Ehlers' autocorrelation work published in TASC
• Original port by blackcat1402; color helpers inspired by RicardoSantos
═════════════════════════════════════════════════════════════════════════
For questions or feedback, use comments section below.
Feel free to use and modify — attribution appreciated.

Don't miss out! The first and most important thing to do is to join my Discord chat now! Click here to start your adventure: discord.com/invite/ZTGpQJq My new github for more pine development soon: github.com/wxt-coder
免責聲明
這些資訊和出版物並非旨在提供,也不構成TradingView提供或認可的任何形式的財務、投資、交易或其他類型的建議或推薦。請閱讀使用條款以了解更多資訊。