OPEN-SOURCE SCRIPT
已更新 Vishall-Directional Probability
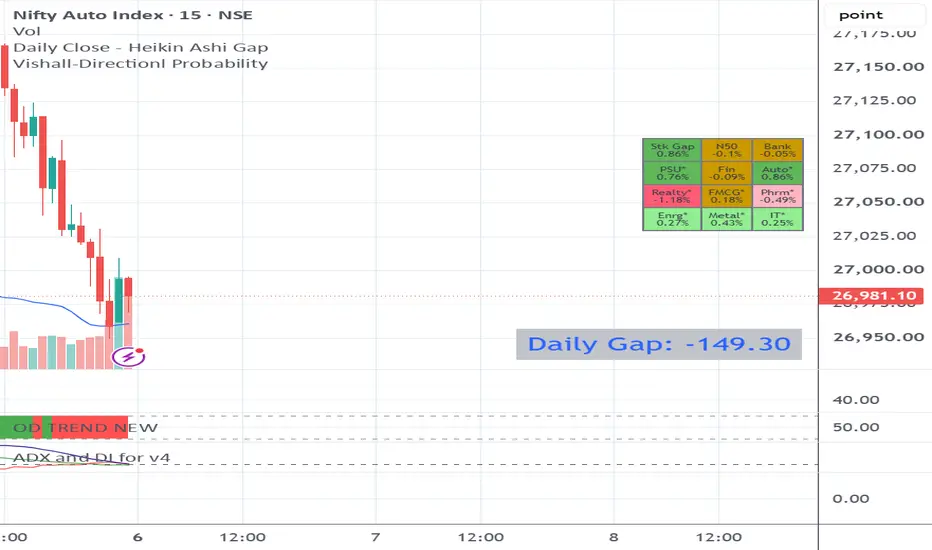
Vishall-Directionl Probability
All * dont have future contracts , based on there stock future contact , in case change in index stock , need to change the Stock here also
-----------------------------------------------------------------------------
If Future HA close is higher than Future normal close, it means the HA chart is still showing strength. It does not directly mean the next day will open lower.
Easy meaning
HA close > normal close = trend is still strong / bullish on that candle.
HA close < normal close = trend is weaker / bearish on that candle.
About next day open
You cannot confirm next day opening lower or higher from this one condition alone. Heikin Ashi is mainly for trend reading, not exact next-day prediction.
Simple rule
If HA candle is green, strong, and no lower wick → upside continuation is more likely.
If HA candle is small, weak, or has long upper wick → trend may slow or reverse.
So in short:
Future HA close > Future normal close = bullish strength, not a guaranteed lower open next day.
-------------------------------------------------------------------------------------------
you can frame this as a probability edge, not a prediction rule. Heikin Ashi is built to smooth noise and help traders see trend direction more clearly, so the useful question is whether the relationship between a, b, c, d improves the chance that the next candle is bullish or bearish.
Your variables
a = future HA close
b = future normal close
c = cash HA close
d = cash normal close
A practical way to read them is by measuring how much each HA close differs from its normal close, then comparing futures and cash. Heikin Ashi closes are averaged values, so the gap between HA close and normal close is a way to read how much smoothing is happening in that market.
Simple correlation idea
Use these two spreads:
F = a - b
C = c - d
Then create:
A = F - C = (a - b) - (c - d)
Interpretation:
A > 0: futures are showing relatively stronger HA support than cash.
A < 0: cash is showing relatively stronger HA support than futures.
A near 0: both are similar, so the signal is weaker.
This is not a guaranteed forecast, but it is a clean way to compare relative trend strength between futures and cash using Heikin Ashi smoothing.
Better probability setup
For better chance of usefulness, do not rely on one formula alone. Add simple conditions:
Bullish bias if a > b, c > d, and A > 0.
Bearish bias if a < b, c < d, and A < 0.
Neutral if the values conflict or A is small.
Heikin Ashi works best for trend continuation and reversal awareness, not exact price targets, so this type of rule is more useful for “which side has better probability” than “where price will exactly go”.
Practical formula options
If you want a stronger single-number score, try:
Score 1 = (a - b) + (c - d), to measure total HA strength.
Score 2 = (a - b) - (c - d), to measure futures vs cash imbalance.
Score 3 = (a / b) - (c / d), if you prefer ratio-based comparison.
Among these, Score 2 is usually the most useful for your purpose because it directly compares futures strength against cash strength. Ratios can help, but subtraction is easier to read and more stable for trading interpretation.
How to use it
For next-day and rest-of-day strength:
Use the formula on multiple past days.
Check whether positive A more often led to green next candles.
Check whether negative A more often led to red next candles.
Keep separate records for intraday and overnight behavior.
---------------------------------------------------------------------------------------
the right way is to normalize A as a percentage, so a ₹10 stock and a Nifty contract can be compared on the same scale. Heikin Ashi itself is meant to smooth price and highlight trend strength, so using raw points alone is not enough when prices are at very different levels.
Normalize the signal
Use this first:
𝐹
=
𝑎
−
𝑏
𝑏
×
100
F=
b
a−b
×100
𝐶
=
𝑐
−
𝑑
𝑑
×
100
C=
d
c−d
×100
𝐴
=
𝐹
−
𝐶
A=F−C
This makes A a relative strength percentage, not a raw rupee difference. That is the cleanest way to compare a low-priced stock with an index or a high-priced stock because the signal becomes size-independent.
What it means
Positive A means futures HA strength is greater than cash HA strength on a percentage basis.
Negative A means cash HA strength is greater than futures HA strength.
Near zero A means both are showing similar relative strength.
This is better than using absolute rupee movement because a ₹1 move is huge for a ₹10 stock but tiny for a ₹20,000 index. Normalizing by price turns the move into a comparable ratio, which is closer to a true strength measure.
Better strength score
If you want one single number, use:
All * dont have future contracts , based on there stock future contact , in case change in index stock , need to change the Stock here also
-----------------------------------------------------------------------------
If Future HA close is higher than Future normal close, it means the HA chart is still showing strength. It does not directly mean the next day will open lower.
Easy meaning
HA close > normal close = trend is still strong / bullish on that candle.
HA close < normal close = trend is weaker / bearish on that candle.
About next day open
You cannot confirm next day opening lower or higher from this one condition alone. Heikin Ashi is mainly for trend reading, not exact next-day prediction.
Simple rule
If HA candle is green, strong, and no lower wick → upside continuation is more likely.
If HA candle is small, weak, or has long upper wick → trend may slow or reverse.
So in short:
Future HA close > Future normal close = bullish strength, not a guaranteed lower open next day.
-------------------------------------------------------------------------------------------
you can frame this as a probability edge, not a prediction rule. Heikin Ashi is built to smooth noise and help traders see trend direction more clearly, so the useful question is whether the relationship between a, b, c, d improves the chance that the next candle is bullish or bearish.
Your variables
a = future HA close
b = future normal close
c = cash HA close
d = cash normal close
A practical way to read them is by measuring how much each HA close differs from its normal close, then comparing futures and cash. Heikin Ashi closes are averaged values, so the gap between HA close and normal close is a way to read how much smoothing is happening in that market.
Simple correlation idea
Use these two spreads:
F = a - b
C = c - d
Then create:
A = F - C = (a - b) - (c - d)
Interpretation:
A > 0: futures are showing relatively stronger HA support than cash.
A < 0: cash is showing relatively stronger HA support than futures.
A near 0: both are similar, so the signal is weaker.
This is not a guaranteed forecast, but it is a clean way to compare relative trend strength between futures and cash using Heikin Ashi smoothing.
Better probability setup
For better chance of usefulness, do not rely on one formula alone. Add simple conditions:
Bullish bias if a > b, c > d, and A > 0.
Bearish bias if a < b, c < d, and A < 0.
Neutral if the values conflict or A is small.
Heikin Ashi works best for trend continuation and reversal awareness, not exact price targets, so this type of rule is more useful for “which side has better probability” than “where price will exactly go”.
Practical formula options
If you want a stronger single-number score, try:
Score 1 = (a - b) + (c - d), to measure total HA strength.
Score 2 = (a - b) - (c - d), to measure futures vs cash imbalance.
Score 3 = (a / b) - (c / d), if you prefer ratio-based comparison.
Among these, Score 2 is usually the most useful for your purpose because it directly compares futures strength against cash strength. Ratios can help, but subtraction is easier to read and more stable for trading interpretation.
How to use it
For next-day and rest-of-day strength:
Use the formula on multiple past days.
Check whether positive A more often led to green next candles.
Check whether negative A more often led to red next candles.
Keep separate records for intraday and overnight behavior.
---------------------------------------------------------------------------------------
the right way is to normalize A as a percentage, so a ₹10 stock and a Nifty contract can be compared on the same scale. Heikin Ashi itself is meant to smooth price and highlight trend strength, so using raw points alone is not enough when prices are at very different levels.
Normalize the signal
Use this first:
𝐹
=
𝑎
−
𝑏
𝑏
×
100
F=
b
a−b
×100
𝐶
=
𝑐
−
𝑑
𝑑
×
100
C=
d
c−d
×100
𝐴
=
𝐹
−
𝐶
A=F−C
This makes A a relative strength percentage, not a raw rupee difference. That is the cleanest way to compare a low-priced stock with an index or a high-priced stock because the signal becomes size-independent.
What it means
Positive A means futures HA strength is greater than cash HA strength on a percentage basis.
Negative A means cash HA strength is greater than futures HA strength.
Near zero A means both are showing similar relative strength.
This is better than using absolute rupee movement because a ₹1 move is huge for a ₹10 stock but tiny for a ₹20,000 index. Normalizing by price turns the move into a comparable ratio, which is closer to a true strength measure.
Better strength score
If you want one single number, use:
發行說明
accuracy improves and better representation發行說明
Accuracy and reliability enhanced 發行說明
Accuracy enhanced and error removes 開源腳本
秉持TradingView一貫精神,這個腳本的創作者將其設為開源,以便交易者檢視並驗證其功能。向作者致敬!您可以免費使用此腳本,但請注意,重新發佈代碼需遵守我們的社群規範。

免責聲明
這些資訊和出版物並非旨在提供,也不構成TradingView提供或認可的任何形式的財務、投資、交易或其他類型的建議或推薦。請閱讀使用條款以了解更多資訊。
開源腳本
秉持TradingView一貫精神,這個腳本的創作者將其設為開源,以便交易者檢視並驗證其功能。向作者致敬!您可以免費使用此腳本,但請注意,重新發佈代碼需遵守我們的社群規範。
免責聲明
這些資訊和出版物並非旨在提供,也不構成TradingView提供或認可的任何形式的財務、投資、交易或其他類型的建議或推薦。請閱讀使用條款以了解更多資訊。