OPEN-SOURCE SCRIPT
已更新 Weekly Stochastic
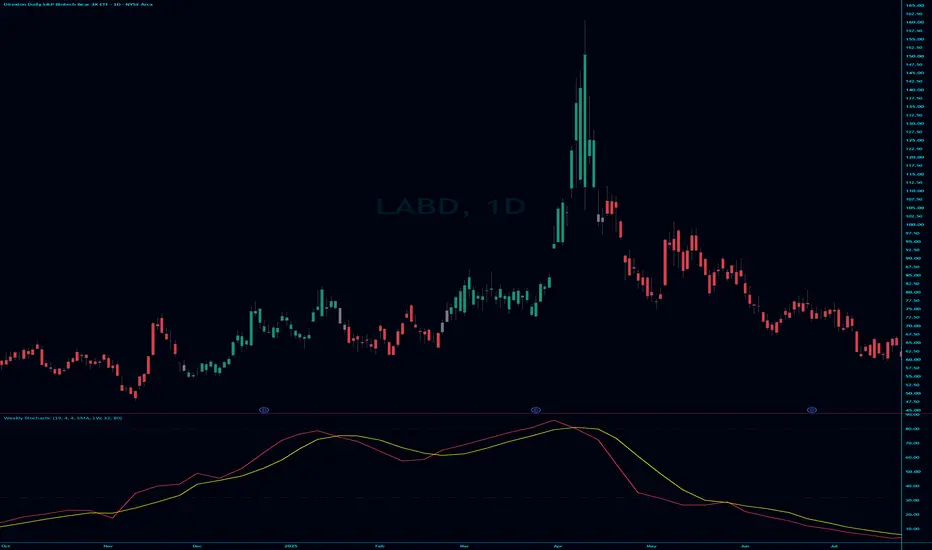
Color of candles depended on the trend. when K crosses over candles are green. when k crosses under candles are red
發行說明
**Weekly Stochastic Trend Tracker**This indicator is designed to identify and highlight major macro trends by using a custom Weekly Stochastic oscillator (19, 4, 4) overlaid onto your current chart. It filters out market noise by applying a strict 4-step state machine to color your candles, ensuring you only see trend signals when momentum is fully confirmed.
**How it Works:**
The indicator calculates a Weekly Stochastic and colors the chart candles based on the following cycle:
* **Gray (Neutral/Shift):** Occurs immediately when the Stochastic `%K` crosses over or under `%D`, signaling a potential momentum shift.
* **Green (Confirmed Uptrend):** After a bullish cross, if `%K` holds above the 32 level for 3 consecutive bars, the candles turn Green to signal a strong uptrend.
* **Red (Confirmed Downtrend):** After a bearish cross, if `%K` stays below 80 and below `%D` for 3 consecutive bars, the candles turn Red to signal a strong downtrend.
**Features:**
* **Multi-Timeframe (MTF):** Operates on weekly data regardless of your chart's timeframe.
* **Non-Repainting Logic:** By default, it waits for the weekly candle to close before locking in signals.
* **Visual Smoothing:** Includes an interpolation toggle to display smooth, straight lines connecting the weekly data points instead of jagged steps on lower timeframes.
* **Custom Smoothing Types:** Allows you to change the Stochastic smoothing calculation (SMA, EMA, WMA, RMA) to fit your preference.
This tool is ideal for swing traders and trend followers looking to stay on the right side of the weekly momentum.
發行說明
I fixed a couple bugs with the grey bars開源腳本
秉持TradingView一貫精神,這個腳本的創作者將其設為開源,以便交易者檢視並驗證其功能。向作者致敬!您可以免費使用此腳本,但請注意,重新發佈代碼需遵守我們的社群規範。

免責聲明
這些資訊和出版物並非旨在提供,也不構成TradingView提供或認可的任何形式的財務、投資、交易或其他類型的建議或推薦。請閱讀使用條款以了解更多資訊。
開源腳本
秉持TradingView一貫精神,這個腳本的創作者將其設為開源,以便交易者檢視並驗證其功能。向作者致敬!您可以免費使用此腳本,但請注意,重新發佈代碼需遵守我們的社群規範。
免責聲明
這些資訊和出版物並非旨在提供,也不構成TradingView提供或認可的任何形式的財務、投資、交易或其他類型的建議或推薦。請閱讀使用條款以了解更多資訊。