OPEN-SOURCE SCRIPT
已更新 Chris and Joe Fractals
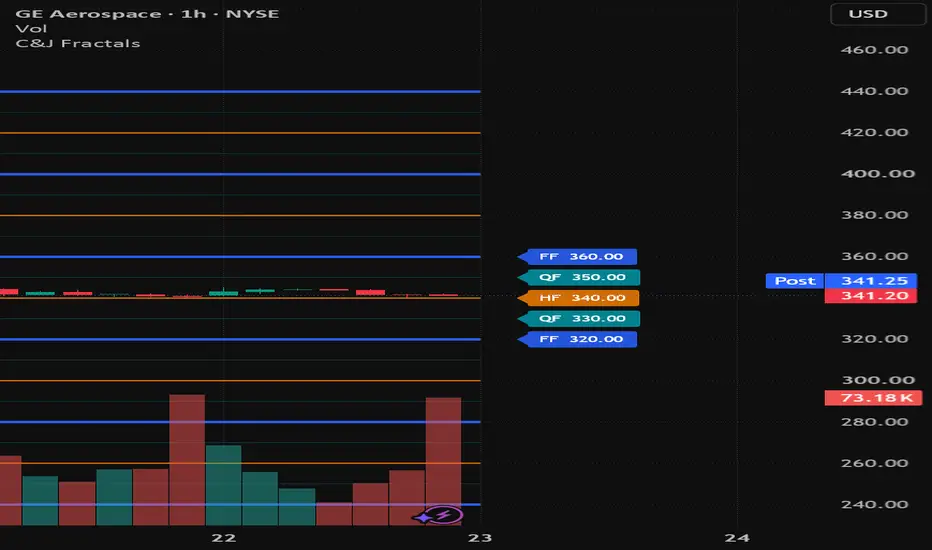
Chris and Joe Fractals implements a fixed Fractal Market Structure price grid for stocks and ETFs. It is not a Bill Williams fractal indicator. Blue lines are Full Fractals (FF), orange dotted lines are Half Fractals (HF), and cyan dashed lines are Quarter Fractals (QF); the grid always extends above and below price.
The Full Fractal remains stable when the chart timeframe changes. Auto mode first uses documented symbol presets, including MET at a $10 FF, then falls back to an adaptive estimate that combines the method's 10% starting rule with four times the confirmed 20-day average daily range and snaps the result to clean price intervals. Use the manual FF override after validating the long-term 3-year/weekly structure.
Signals are market-structure gated. Confirmed pivot highs and lows classify bullish HH/HL structure, bearish LH/LL structure, or a range; local structure must agree with the higher-timeframe context before a CALL or PUT marker can appear. By default, two candle-body closes or a body-hold retest must confirm the fractal boundary. Auto mode uses 5-30 minute charts for day signals and 1-hour through daily charts for swing signals. Day exits use the next QF, active-quarter midpoint failure, structural invalidation, or session end; swing exits use the next HF, midpoint failure, or a structure change.
This tool organizes price action and does not predict outcomes. Validate the FF and market context yourself. Educational use only, not financial advice.
The Full Fractal remains stable when the chart timeframe changes. Auto mode first uses documented symbol presets, including MET at a $10 FF, then falls back to an adaptive estimate that combines the method's 10% starting rule with four times the confirmed 20-day average daily range and snaps the result to clean price intervals. Use the manual FF override after validating the long-term 3-year/weekly structure.
Signals are market-structure gated. Confirmed pivot highs and lows classify bullish HH/HL structure, bearish LH/LL structure, or a range; local structure must agree with the higher-timeframe context before a CALL or PUT marker can appear. By default, two candle-body closes or a body-hold retest must confirm the fractal boundary. Auto mode uses 5-30 minute charts for day signals and 1-hour through daily charts for swing signals. Day exits use the next QF, active-quarter midpoint failure, structural invalidation, or session end; swing exits use the next HF, midpoint failure, or a structure change.
This tool organizes price action and does not predict outcomes. Validate the FF and market context yourself. Educational use only, not financial advice.
發行說明
Corrected the AAPL preset to a $40 Full Fractal so it matches the latest validated long-term structure.發行說明
Fixed chart scaling so fractal levels, reasoning, and trade labels remain attached to the symbol price scale while zooming or panning. Replaced dotted lines and triangle/X markers with solid FF, HF, and QF levels plus staged Potential, Enter, Potential Exit, and Exit labels. Swing signals shown on intraday charts now use completed daily candle bodies; day signals continue to use completed 5-30 minute candles. Added aligned market-structure scoring, cooldown and repeated-level suppression, a small price-attached reasoning note, and historical diagnostics in the Data Window. Compiled and tested on VICI, AAPL, MET, NVDA, and QQQ. Historical results vary by symbol and do not guarantee future performance.發行說明
Removed the independent price scale so every fractal level and message stays attached to the symbol during chart dragging, price-axis zooming, and auto-scale. Removed all bearish option entries; the script now produces bullish call setups and call exits only. Auto mode uses day-call logic on 5-30 minute charts, swing-call logic from 1 hour through daily, and structure-only analysis on weekly and monthly charts. Full-fractal spacing and market-structure sensitivity now adapt by timeframe and longer-term volatility regime. Verified the fresh single chart instance by physically dragging and zooming RKLB and VICI and by checking distinct signal counts from 15 minutes through monthly.發行說明
Replaced every staged call marker with a true price-coordinate label anchored to its signal candle by bar_index and yloc.price. Potential Day Call, Potential Swing Call, entry, warning, and exit messages now pan and zoom with the candles. Added adaptive ATR/fractal spacing around each signal candle and automatic pruning of old labels. Removed all cached chart instances, added one fresh compiled instance, and physically verified downward drag, reverse drag, and price-axis zoom on VICI 15-minute before publishing.發行說明
.發行說明
.發行說明
Corrected chart-attached labels and confirmed day-call and swing-call entry and exit signals.發行說明
Updated the public chart preview with verified swing entry and exit labels.發行說明
Updated the public chart preview so confirmed swing entry and exit labels are visible.發行說明
Kept the single active fractal grid visible with confirmed historical swing labels.發行說明
Adds price-attached day and swing call entry and exit triangles with closed-candle fractal and market-structure confirmation. Day trades are managed for 1-4 hours; swing trades for 1-3 days.發行說明
Updated confirmed call signals and price-anchored entry and exit markers.發行說明
Rebalanced confirmed call entries with market alignment, closer fractal objectives, and price-anchored day and swing markers.開源腳本
秉持TradingView一貫精神,這個腳本的創作者將其設為開源,以便交易者檢視並驗證其功能。向作者致敬!您可以免費使用此腳本,但請注意,重新發佈代碼需遵守我們的社群規範。

免責聲明
這些資訊和出版物並非旨在提供,也不構成TradingView提供或認可的任何形式的財務、投資、交易或其他類型的建議或推薦。請閱讀使用條款以了解更多資訊。
免責聲明
這些資訊和出版物並非旨在提供,也不構成TradingView提供或認可的任何形式的財務、投資、交易或其他類型的建議或推薦。請閱讀使用條款以了解更多資訊。