Distributional Rank | NAL
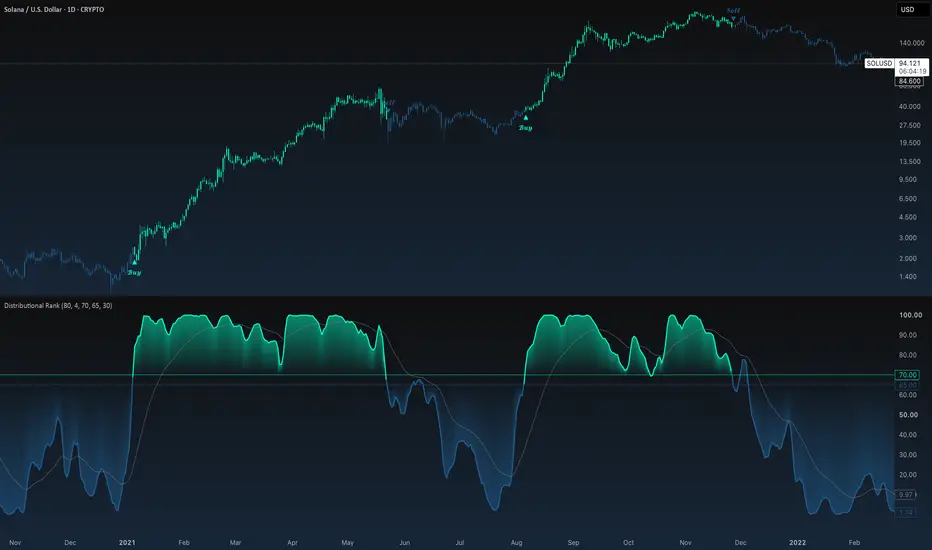
Price is more than a sequence of returns. It is also a position within a statistical distribution.
Distributional Rank is a quantitative trend-classification oscillator that measures where the current closing price stands within its own historical price distribution.
Traditional momentum indicators primarily measure the magnitude or direction of price changes. Distributional Rank approaches market strength from a different perspective: rather than asking how quickly price is moving, it asks how elevated or depressed the current price is relative to the observations that preceded it.
The indicator combines empirical percentile ranking, quartile-based robust smoothing, and optional momentum confluence to transform this statistical position into a persistent directional regime.
The result is a normalized, distribution-aware framework for assessing relative price strength without relying on conventional moving-average crossovers or fixed price-distance measurements.
1. Empirical Distributional Ranking
At the center of the model is a rolling empirical distribution of closing prices.
For each observation, the indicator constructs a historical price window, sorts its values, and evaluates 99 interpolated percentile levels against the current close.
Pine Script®
The number of percentile levels below the current price determines the raw distributional score, normalized to a scale from 0 to 100.
A high reading indicates that the current close stands above a substantial proportion of the interpolated historical percentile levels. A low reading indicates that price occupies a relatively depressed position within the observed distribution.
The score represents relative price location, not the probability of a future price movement.
This distinction makes Distributional Rank fundamentally different from conventional RSI or rate-of-change indicators.
2. Quartile-Weighted Robust Smoothing
Raw percentile rankings can change abruptly as prices move through their historical distribution.
To produce a more structured measurement, the model applies a quartile-based smoothing method commonly known as Tukey's trimean.
Three statistical levels are calculated from the recent history of the raw distributional score:
These components are combined with twice the weight assigned to the median.
Pine Script®
Unlike conventional arithmetic averaging, this construction emphasizes the central portion of the score distribution while retaining information from both quartiles.
The resulting oscillator is less sensitive to isolated extreme observations than a simple arithmetic mean, providing a more robust estimate of the prevailing distributional position.
3. EMA Confluence
An optional EMA filter introduces a second dimension to the model: whether the current distributional rank is strengthening or weakening relative to its own smoothed history.
Pine Script®
When enabled, bullish conditions require the distributional score to exceed its EMA, while bearish conditions require the score to remain below it.
This separates two related but distinct characteristics:
For example, price may remain near the upper region of its historical distribution while its rank begins to deteriorate. The EMA confluence filter allows the model to distinguish this condition from one in which both distributional position and relative strength remain aligned.
4. Directional Regime & Hysteresis
The final directional classification combines the smoothed distributional score with configurable upper and lower thresholds.
Using separate upper and lower thresholds creates a form of hysteresis.
With the default thresholds of 70 and 65, the model requires a higher distributional rank to establish bullish conditions than the level used to establish bearish conditions.
The intermediate region acts as a transition buffer rather than immediately forcing a new classification.
This reduces unnecessary state changes caused by repeated fluctuations around a single threshold.
Visuals & Interpretation
Distributional Rank displays the smoothed statistical score as a continuously updated oscillator, with its appearance reflecting the established directional regime.
The visualization includes:
The data window also exposes the raw number of percentile levels below the current price and the active directional state.
Practical Application
Distributional Rank is designed to study relative price positioning, distributional persistence, and changes in statistically defined directional strength.
Its primary analytical distinction lies in evaluating price through its empirical distribution rather than through absolute returns or conventional momentum oscillation.
A market can experience positive returns without occupying a particularly strong position within its broader historical distribution. Conversely, price can maintain a relatively elevated distributional rank even as short-term momentum begins to weaken.
Distributional Rank makes this relationship observable through a single normalized measure.
The central question is not simply whether price is rising or falling, but whether its position within the recent distribution supports the prevailing directional regime.
Automated Alerts
The indicator includes two built-in alerts:
Both alerts require a confirmed bar and trigger only when the directional state changes.
Configuration
Users can independently adjust the historical ranking window, quartile smoothing period, directional thresholds, EMA confluence, and EMA observation length.
The model is fully configurable while maintaining its underlying distributional ranking architecture.
Distributional Rank is a quantitative trend-classification oscillator that measures where the current closing price stands within its own historical price distribution.
Traditional momentum indicators primarily measure the magnitude or direction of price changes. Distributional Rank approaches market strength from a different perspective: rather than asking how quickly price is moving, it asks how elevated or depressed the current price is relative to the observations that preceded it.
The indicator combines empirical percentile ranking, quartile-based robust smoothing, and optional momentum confluence to transform this statistical position into a persistent directional regime.
The result is a normalized, distribution-aware framework for assessing relative price strength without relying on conventional moving-average crossovers or fixed price-distance measurements.
1. Empirical Distributional Ranking
At the center of the model is a rolling empirical distribution of closing prices.
For each observation, the indicator constructs a historical price window, sorts its values, and evaluates 99 interpolated percentile levels against the current close.
The number of percentile levels below the current price determines the raw distributional score, normalized to a scale from 0 to 100.
A high reading indicates that the current close stands above a substantial proportion of the interpolated historical percentile levels. A low reading indicates that price occupies a relatively depressed position within the observed distribution.
The score represents relative price location, not the probability of a future price movement.
This distinction makes Distributional Rank fundamentally different from conventional RSI or rate-of-change indicators.
2. Quartile-Weighted Robust Smoothing
Raw percentile rankings can change abruptly as prices move through their historical distribution.
To produce a more structured measurement, the model applies a quartile-based smoothing method commonly known as Tukey's trimean.
Three statistical levels are calculated from the recent history of the raw distributional score:
- 25th Percentile (Q1) — represents the lower quartile.
- 50th Percentile (Median) — represents the central observation.
- 75th Percentile (Q3) — represents the upper quartile.
These components are combined with twice the weight assigned to the median.
Unlike conventional arithmetic averaging, this construction emphasizes the central portion of the score distribution while retaining information from both quartiles.
The resulting oscillator is less sensitive to isolated extreme observations than a simple arithmetic mean, providing a more robust estimate of the prevailing distributional position.
3. EMA Confluence
An optional EMA filter introduces a second dimension to the model: whether the current distributional rank is strengthening or weakening relative to its own smoothed history.
When enabled, bullish conditions require the distributional score to exceed its EMA, while bearish conditions require the score to remain below it.
This separates two related but distinct characteristics:
- Distributional Position — where price stands relative to its historical distribution.
- Rank Momentum — whether that relative position is improving or deteriorating against its own trend.
For example, price may remain near the upper region of its historical distribution while its rank begins to deteriorate. The EMA confluence filter allows the model to distinguish this condition from one in which both distributional position and relative strength remain aligned.
4. Directional Regime & Hysteresis
The final directional classification combines the smoothed distributional score with configurable upper and lower thresholds.
- Bullish Regime — the score reaches or exceeds the upper threshold, with positive EMA confluence when enabled.
- Bearish Regime — the score falls below the lower threshold, with negative EMA confluence when enabled.
- Regime Persistence — when neither condition is satisfied, the previous directional state is maintained.
Using separate upper and lower thresholds creates a form of hysteresis.
With the default thresholds of 70 and 65, the model requires a higher distributional rank to establish bullish conditions than the level used to establish bearish conditions.
The intermediate region acts as a transition buffer rather than immediately forcing a new classification.
This reduces unnecessary state changes caused by repeated fluctuations around a single threshold.
Visuals & Interpretation
Distributional Rank displays the smoothed statistical score as a continuously updated oscillator, with its appearance reflecting the established directional regime.
The visualization includes:
- Distributional Rank Curve — the primary 0–100 statistical oscillator.
- Directional Thresholds — configurable upper and lower boundaries used for regime classification.
- EMA Reference — an optional moving average of the smoothed distributional score.
- Gradient Structure — regime-colored gradients extending between the oscillator and its relevant threshold.
- Trend-Colored Candles — transfers the prevailing directional classification onto the main price chart.
The data window also exposes the raw number of percentile levels below the current price and the active directional state.
Practical Application
Distributional Rank is designed to study relative price positioning, distributional persistence, and changes in statistically defined directional strength.
Its primary analytical distinction lies in evaluating price through its empirical distribution rather than through absolute returns or conventional momentum oscillation.
A market can experience positive returns without occupying a particularly strong position within its broader historical distribution. Conversely, price can maintain a relatively elevated distributional rank even as short-term momentum begins to weaken.
Distributional Rank makes this relationship observable through a single normalized measure.
The central question is not simply whether price is rising or falling, but whether its position within the recent distribution supports the prevailing directional regime.
Automated Alerts
The indicator includes two built-in alerts:
- Bullish Transition — activates when the model changes into a bullish distributional regime.
- Bearish Transition — activates when the model changes into a bearish distributional regime.
Both alerts require a confirmed bar and trigger only when the directional state changes.
Configuration
Users can independently adjust the historical ranking window, quartile smoothing period, directional thresholds, EMA confluence, and EMA observation length.
The model is fully configurable while maintaining its underlying distributional ranking architecture.

🔵 Access our best trading & investing tools, get a 30-day free trial today: whop.com/nordic-alpha-lab/
免責聲明
這些資訊和出版物並非旨在提供,也不構成TradingView提供或認可的任何形式的財務、投資、交易或其他類型的建議或推薦。請閱讀使用條款以了解更多資訊。
🔵 Access our best trading & investing tools, get a 30-day free trial today: whop.com/nordic-alpha-lab/
免責聲明
這些資訊和出版物並非旨在提供,也不構成TradingView提供或認可的任何形式的財務、投資、交易或其他類型的建議或推薦。請閱讀使用條款以了解更多資訊。