Session Matrix Pro
# Session Matrix Pro
## Overview
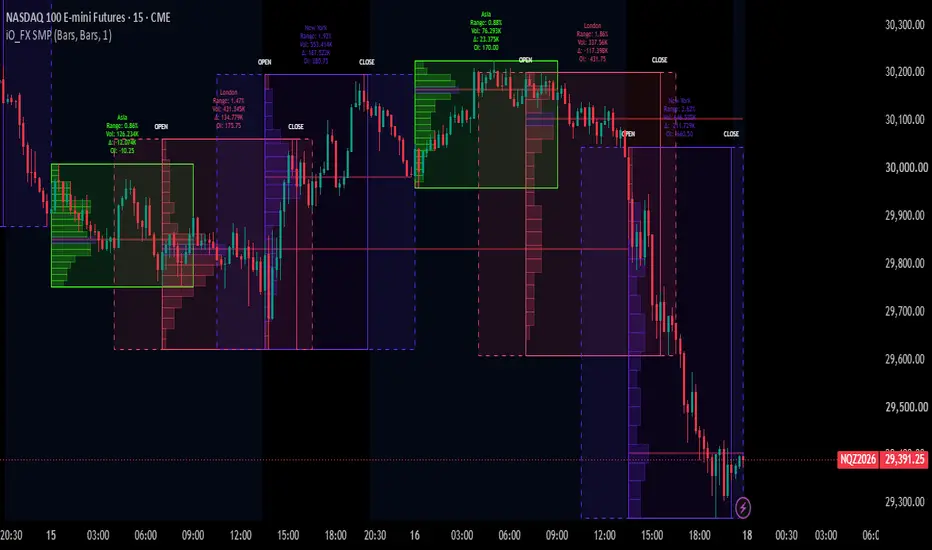
** Session Matrix Pro** is an advanced session analysis toolkit that shows how the world's major trading sessions behave. Rather than just marking session boxes, it combines **market structure, volume profile, volume delta, open interest, naked POCs, and historical session projections** into one visual framework.
It covers the **New York, London, and Asia sessions**, so you can study liquidity, participation, and session characteristics with minimal chart clutter.
---
## ⚠️ Important: Read Before Use
**This is a heavy indicator, built specifically for markets with real, centralized volume data, such as the Futures market.**
Many of its core calculations depend on accurate volume: session volume, volume delta, the volume profile, and naked POCs. Futures, and other markets with real volume, provide the data these features need.
**The creator of this indicator does not recommend using it on CFD or spot markets.** Volume on those instruments is usually tick volume or broker-specific volume, which does not reflect true market participation. Volume-based outputs there (volume, delta, profile, POCs) can be misleading or unreliable.
Because of the amount it calculates and draws, it can also load slowly on lower timeframes or with a lot of historical data.
---
## Features
### Global Trading Sessions
* New York, London, and Asia sessions
* Individual color for each session
* Show or hide any session
### Pre-Market & Post-Market
Shows activity before and after each session (marked "OPEN" and "CLOSE"), so you can see accumulation, distribution, and the transitions between sessions.
### Session Statistics
Each session label updates with:
* Session Range (%)
* Total Volume
* Volume Delta (buy vs. sell pressure)
* Open Interest Change *(supported crypto symbols only)*
### Session Volume Profile
Choose between:
* **Letters:** TPO-style profile
* **Bars:** volume-style profile
* **None:** disable the profile
It highlights where price spent the most time during each session.
### Naked Point of Control (POC)
Plots each session's POC and extends it forward until price revisits it, making unvisited reference levels easy to spot.
### Historical Session Projection
Based on how previous sessions behaved, the indicator projects a possible path for the current session using:
* **Projection Bars**
* **Projection Line**
* Optional **ATR-adjusted** projection range
The projection is statistical guidance based on historical behavior, not a prediction of future price.
---
## Settings
* **Show Projection:** Bars / Line / None
* **Profile Type:** Letters / Bars / None
* **Profile Bar Multiplier:** scales the profile bar length
* **Use ATR in Projection:** adjusts projection range with ATR
* **Show Pre-Market / Post-Market**
* **Show Naked POCs**
* **Remove Box Border Color / Box BG Color**
* **Session visibility and colors** for New York, London, and Asia
---
## Session Times
Sessions are based on **America/New_York time** and adjust slightly depending on the chart timeframe:
* **New York:** 09:30–16:00 (09:00 start on timeframes above 30 minutes)
* **London:** 03:00–11:30 (11:00 end on timeframes above 30 minutes)
* **Asia:** 20:00–05:00
---
## Best Used For
* Futures (recommended)
* Other markets with real, reliable volume data
* Intraday traders who rely on session behavior, liquidity shifts, and market structure
**Not recommended for CFD or spot markets** (see the notice above).
---
## Notes
* Open Interest is shown only on supported crypto symbols.
* Projections are based on previous session statistics and should be used as a reference, not as a trading signal.
* Performance depends on the selected timeframe and the amount of historical data loaded.
* Use on intraday timeframes for the best results.
---
If you find this indicator useful, consider leaving a 👍 and adding it to your favorites. Feedback and suggestions are always appreciated.
© iO_FX. All rights reserved.
**Disclaimer:** This indicator is for educational and informational purposes only and is not financial advice. Trading involves risk. Always do your own research and manage your risk.
## Overview
** Session Matrix Pro** is an advanced session analysis toolkit that shows how the world's major trading sessions behave. Rather than just marking session boxes, it combines **market structure, volume profile, volume delta, open interest, naked POCs, and historical session projections** into one visual framework.
It covers the **New York, London, and Asia sessions**, so you can study liquidity, participation, and session characteristics with minimal chart clutter.
---
## ⚠️ Important: Read Before Use
**This is a heavy indicator, built specifically for markets with real, centralized volume data, such as the Futures market.**
Many of its core calculations depend on accurate volume: session volume, volume delta, the volume profile, and naked POCs. Futures, and other markets with real volume, provide the data these features need.
**The creator of this indicator does not recommend using it on CFD or spot markets.** Volume on those instruments is usually tick volume or broker-specific volume, which does not reflect true market participation. Volume-based outputs there (volume, delta, profile, POCs) can be misleading or unreliable.
Because of the amount it calculates and draws, it can also load slowly on lower timeframes or with a lot of historical data.
---
## Features
### Global Trading Sessions
* New York, London, and Asia sessions
* Individual color for each session
* Show or hide any session
### Pre-Market & Post-Market
Shows activity before and after each session (marked "OPEN" and "CLOSE"), so you can see accumulation, distribution, and the transitions between sessions.
### Session Statistics
Each session label updates with:
* Session Range (%)
* Total Volume
* Volume Delta (buy vs. sell pressure)
* Open Interest Change *(supported crypto symbols only)*
### Session Volume Profile
Choose between:
* **Letters:** TPO-style profile
* **Bars:** volume-style profile
* **None:** disable the profile
It highlights where price spent the most time during each session.
### Naked Point of Control (POC)
Plots each session's POC and extends it forward until price revisits it, making unvisited reference levels easy to spot.
### Historical Session Projection
Based on how previous sessions behaved, the indicator projects a possible path for the current session using:
* **Projection Bars**
* **Projection Line**
* Optional **ATR-adjusted** projection range
The projection is statistical guidance based on historical behavior, not a prediction of future price.
---
## Settings
* **Show Projection:** Bars / Line / None
* **Profile Type:** Letters / Bars / None
* **Profile Bar Multiplier:** scales the profile bar length
* **Use ATR in Projection:** adjusts projection range with ATR
* **Show Pre-Market / Post-Market**
* **Show Naked POCs**
* **Remove Box Border Color / Box BG Color**
* **Session visibility and colors** for New York, London, and Asia
---
## Session Times
Sessions are based on **America/New_York time** and adjust slightly depending on the chart timeframe:
* **New York:** 09:30–16:00 (09:00 start on timeframes above 30 minutes)
* **London:** 03:00–11:30 (11:00 end on timeframes above 30 minutes)
* **Asia:** 20:00–05:00
---
## Best Used For
* Futures (recommended)
* Other markets with real, reliable volume data
* Intraday traders who rely on session behavior, liquidity shifts, and market structure
**Not recommended for CFD or spot markets** (see the notice above).
---
## Notes
* Open Interest is shown only on supported crypto symbols.
* Projections are based on previous session statistics and should be used as a reference, not as a trading signal.
* Performance depends on the selected timeframe and the amount of historical data loaded.
* Use on intraday timeframes for the best results.
---
If you find this indicator useful, consider leaving a 👍 and adding it to your favorites. Feedback and suggestions are always appreciated.
© iO_FX. All rights reserved.
**Disclaimer:** This indicator is for educational and informational purposes only and is not financial advice. Trading involves risk. Always do your own research and manage your risk.

免責聲明
這些資訊和出版物並非旨在提供,也不構成TradingView提供或認可的任何形式的財務、投資、交易或其他類型的建議或推薦。請閱讀使用條款以了解更多資訊。