OPEN-SOURCE SCRIPT
已更新 Stocks: Financial Summary [invincible3]
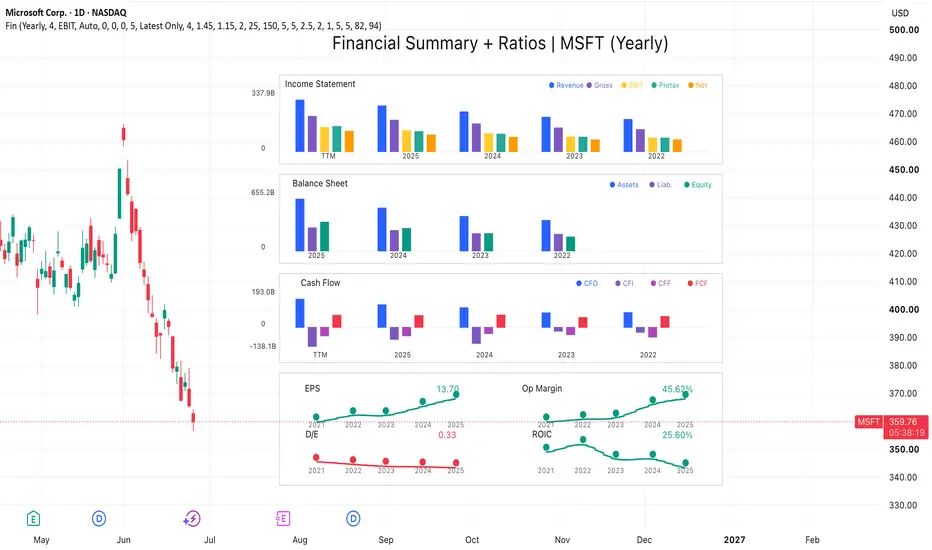
Stocks: Financial Summary [invincible3]
Stocks: Financial Summary is a compact fundamental dashboard designed to visualize a company’s key financial statements directly on the TradingView chart.
The indicator displays three major financial sections:
Income Statement
Revenue, Gross Profit, EBIT or Operating Income, Pretax Income, and Net Income.
Balance Sheet
Total Assets, Total Liabilities, and Shareholders’ Equity.
Cash Flow
Cash Flow from Operations, Cash Flow from Investing, Cash Flow from Financing, and Free Cash Flow.
The dashboard is drawn on the right side of the chart using a clean multi-panel bar-chart layout. It allows traders and investors to quickly compare historical yearly or quarterly financial data without leaving the price chart.
Key Features
* Supports Yearly and Quarterly financial views.
* Optional TTM display for Income Statement and Cash Flow.
* Visual comparison of historical financial periods.
* Auto unit formatting: Raw, K, M, B, and T.
* Customizable dashboard position, spacing, bar width, colors, and transparency.
* Right-side layout designed to keep the price chart readable.
* Uses actual TradingView financial data through `request.financial()`.
* Includes manual fiscal year and quarter override options when exchange reporting labels need adjustment.
This tool is designed for fundamental analysis, long-term stock screening, and quick financial statement comparison. It can help users visually inspect whether a company’s revenue, profitability, assets, liabilities, cash flow, and free cash flow are improving or weakening over time.
This indicator is for educational and informational purposes only. It is not financial advice.
Stocks: Financial Summary is a compact fundamental dashboard designed to visualize a company’s key financial statements directly on the TradingView chart.
The indicator displays three major financial sections:
Income Statement
Revenue, Gross Profit, EBIT or Operating Income, Pretax Income, and Net Income.
Balance Sheet
Total Assets, Total Liabilities, and Shareholders’ Equity.
Cash Flow
Cash Flow from Operations, Cash Flow from Investing, Cash Flow from Financing, and Free Cash Flow.
The dashboard is drawn on the right side of the chart using a clean multi-panel bar-chart layout. It allows traders and investors to quickly compare historical yearly or quarterly financial data without leaving the price chart.
Key Features
* Supports Yearly and Quarterly financial views.
* Optional TTM display for Income Statement and Cash Flow.
* Visual comparison of historical financial periods.
* Auto unit formatting: Raw, K, M, B, and T.
* Customizable dashboard position, spacing, bar width, colors, and transparency.
* Right-side layout designed to keep the price chart readable.
* Uses actual TradingView financial data through `request.financial()`.
* Includes manual fiscal year and quarter override options when exchange reporting labels need adjustment.
This tool is designed for fundamental analysis, long-term stock screening, and quick financial statement comparison. It can help users visually inspect whether a company’s revenue, profitability, assets, liabilities, cash flow, and free cash flow are improving or weakening over time.
This indicator is for educational and informational purposes only. It is not financial advice.
發行說明
Added a new Ratios section to the Financial Summary dashboard. The update now includes mini trend cards for key financial ratios, including EPS, Operating Margin, Debt-to-Equity, and ROIC. Each ratio card shows historical yearly movement using compact curve visualization, year labels, dots, and latest value text.
The ratio section is designed to provide a quick view of profitability, leverage, and capital efficiency directly alongside the income statement, balance sheet, and cash flow panels. Layout handling was also improved so the financial statement sections and ratio cards fit together more cleanly on the right side of the chart.
Visual improvements include solid ratio curves, cleaner latest-value labels without background boxes, adjustable ratio curve width, and better spacing for readability.
開源腳本
秉持TradingView一貫精神,這個腳本的創作者將其設為開源,以便交易者檢視並驗證其功能。向作者致敬!您可以免費使用此腳本,但請注意,重新發佈代碼需遵守我們的社群規範。

免責聲明
這些資訊和出版物並非旨在提供,也不構成TradingView提供或認可的任何形式的財務、投資、交易或其他類型的建議或推薦。請閱讀使用條款以了解更多資訊。
開源腳本
秉持TradingView一貫精神,這個腳本的創作者將其設為開源,以便交易者檢視並驗證其功能。向作者致敬!您可以免費使用此腳本,但請注意,重新發佈代碼需遵守我們的社群規範。
免責聲明
這些資訊和出版物並非旨在提供,也不構成TradingView提供或認可的任何形式的財務、投資、交易或其他類型的建議或推薦。請閱讀使用條款以了解更多資訊。