Liquidity Sweep Engulfing + Trade Manager
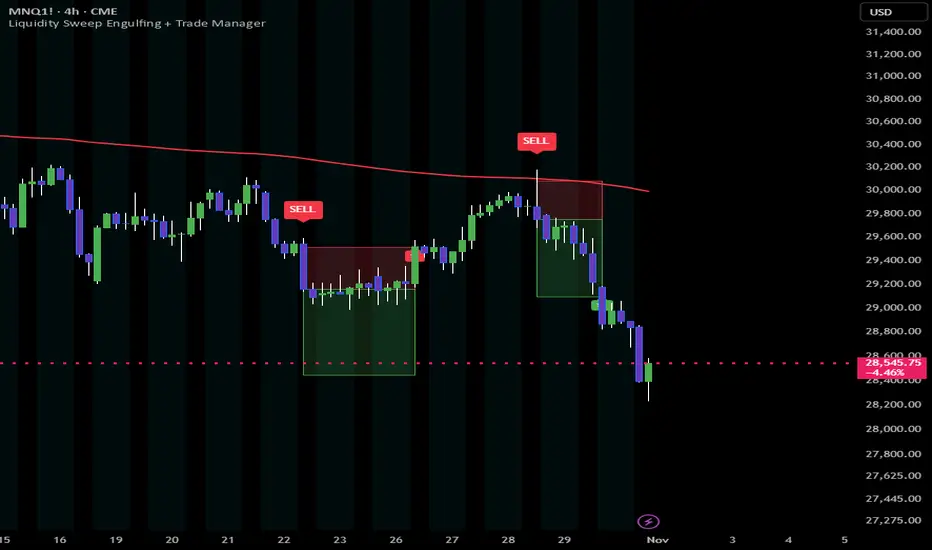
Liquidity Sweep Engulfing + Trade Manager Indicator
This TradingView indicator is designed to identify potential market reversals and continuation opportunities by combining liquidity sweeps, engulfing candles, EMA trend direction, and automated risk management.
The goal is to identify when price takes out a previous candle's high or low, rejects that move, and closes strongly in the opposite direction.
It then automatically plots a potential entry, stop loss, and take profit on the chart.
1. How the buy signal works
Trading XAUUSD: Cara Menangkap Liquidity Sweep yang Sering Bikin Trader Rugi! | QuickPro
A BUY signal appears when:
The current candle takes out the previous candle's low.
Price reverses upward.
The current candle closes above the previous candle's high.
The current candle closes bullish.
This suggests that price may have taken liquidity below the previous candle before moving higher.
What you're looking for: Price sweeps the previous low, rejects lower prices, and closes above the previous candle's entire range.
2. How the sell signal works
lsr [Xpressnets]
A SELL signal appears when:
The current candle takes out the previous candle's high.
Price reverses downward.
The current candle closes below the previous candle's low.
The current candle closes bearish.
This suggests that price may have taken liquidity above the previous candle before moving lower.
What you're looking for: Price sweeps the previous high, rejects higher prices, and closes below the previous candle's entire range.
3. Previous candle direction settings
The indicator allows you to decide which previous candle formations qualify.
Setting
Description
Same Direction
Previous candle must match the signal direction.
Mixed
Previous candle can be bullish or bearish.
For example:
A bullish signal with Same Direction requires the previous candle to be bullish.
A bearish signal with Same Direction requires the previous candle to be bearish.
Mixed allows either previous candle direction for both setups.
This gives you flexibility to test different market conditions.
4. EMA trend filter
3 Ways to Use Moving Averages in a Trading Strategy
The indicator includes an optional EMA trend filter.
Green EMA
Price is above the EMA. Only BUY signals are allowed.
Red EMA
Price is below the EMA. Only SELL signals are allowed.
There is one checkbox that controls the entire EMA feature.
Enabled: Displays the EMA and filters signals according to trend direction.
Disabled: Hides the EMA and allows both BUY and SELL signals without trend restrictions.
Important: Turning off the EMA does not disable the stop-loss, take-profit, or trade-management functionality.
5. Automatic take-profit and stop-loss
Whenever a valid signal occurs, the indicator automatically creates two boxes on the chart.
Piattaforma TradingView - Strumenti di Misurazione e Proiezione di un'operazione
Green
box
Take-profit zone.
Red
box
Stop-loss zone.
The boxes initially extend five candles into the future.
As price moves forward, the boxes continue extending until the take-profit or stop-loss is reached.
This makes it easy to visualize the potential trade without manually drawing risk/reward levels.
6. Risk management settings
The indicator has two stop-loss methods.
Option 1: ATR-based stop loss
Uses Average True Range to calculate the stop-loss distance.
For example:
ATR length: 14
Stop-loss multiplier: 1.5
Take-profit multiplier: 3.0
This means the stop loss is 1.5 ATR away from entry, and the take profit is 3 ATR away from entry.
Option 2: Signal candle high/low
BUY: Stop loss is placed at the signal candle's low.
SELL: Stop loss is placed at the signal candle's high.
The take-profit distance is calculated using the selected risk/reward ratio.
7. One trade at a time
This is one of the most important features.
The indicator uses trade management to prevent signals from continuously appearing while a previous trade is still active.
The process works like this:
1. Valid BUY or SELL signal appears
2. Entry, stop loss and take profit are calculated
3. Trade becomes active
No new signals are allowed.
Take profit hit
Trade closes.
Stop loss hit
Trade closes.
4. Indicator unlocks
It can now identify the next valid signal.
8. Indicator settings summary
Setting
Purpose
Previous Candle Direction
Same Direction or Mixed
Enable EMA Trend Filter
Turns EMA and trend filtering on/off
EMA Length
Controls EMA period
ATR Length
Controls ATR calculation
Stop Loss Method
ATR or Signal Candle High/Low
Stop Loss ATR Multiplier
Controls ATR stop distance
Risk/Reward Ratio
Controls reward relative to risk in candle-stop mode
Take Profit ATR Multiplier
Controls ATR target distance
Show Buy/Sell Signals
Displays signal labels
Show TP/SL Boxes
Displays trade zones
Initial Box Extension
Number of bars initially displayed ahead
9. The overall trading concept
The indicator is built around three main ideas:
Liquidity: Price takes out a previous candle's high or low.
Confirmation: Price reverses and engulfs the previous candle's range.
Trade management: The indicator plots entry, stop loss, and take profit while allowing only one active setup at a time.
The idea is to identify potential moves after liquidity has been taken, rather than entering simply because price touches a previous high or low.
One important distinction: This is a technical setup indicator, not proof that institutional liquidity was taken or that a reversal will occur. Signals are confirmed at candle close, and historical TP/SL results can be ambiguous when both levels fall within the same candle.
Also, the current script uses a fixed ATR target in ATR stop mode, while the signal-candle stop mode uses the R/R setting. These are two different target calculation methods.
This TradingView indicator is designed to identify potential market reversals and continuation opportunities by combining liquidity sweeps, engulfing candles, EMA trend direction, and automated risk management.
The goal is to identify when price takes out a previous candle's high or low, rejects that move, and closes strongly in the opposite direction.
It then automatically plots a potential entry, stop loss, and take profit on the chart.
1. How the buy signal works
Trading XAUUSD: Cara Menangkap Liquidity Sweep yang Sering Bikin Trader Rugi! | QuickPro
A BUY signal appears when:
The current candle takes out the previous candle's low.
Price reverses upward.
The current candle closes above the previous candle's high.
The current candle closes bullish.
This suggests that price may have taken liquidity below the previous candle before moving higher.
What you're looking for: Price sweeps the previous low, rejects lower prices, and closes above the previous candle's entire range.
2. How the sell signal works
lsr [Xpressnets]
A SELL signal appears when:
The current candle takes out the previous candle's high.
Price reverses downward.
The current candle closes below the previous candle's low.
The current candle closes bearish.
This suggests that price may have taken liquidity above the previous candle before moving lower.
What you're looking for: Price sweeps the previous high, rejects higher prices, and closes below the previous candle's entire range.
3. Previous candle direction settings
The indicator allows you to decide which previous candle formations qualify.
Setting
Description
Same Direction
Previous candle must match the signal direction.
Mixed
Previous candle can be bullish or bearish.
For example:
A bullish signal with Same Direction requires the previous candle to be bullish.
A bearish signal with Same Direction requires the previous candle to be bearish.
Mixed allows either previous candle direction for both setups.
This gives you flexibility to test different market conditions.
4. EMA trend filter
3 Ways to Use Moving Averages in a Trading Strategy
The indicator includes an optional EMA trend filter.
Green EMA
Price is above the EMA. Only BUY signals are allowed.
Red EMA
Price is below the EMA. Only SELL signals are allowed.
There is one checkbox that controls the entire EMA feature.
Enabled: Displays the EMA and filters signals according to trend direction.
Disabled: Hides the EMA and allows both BUY and SELL signals without trend restrictions.
Important: Turning off the EMA does not disable the stop-loss, take-profit, or trade-management functionality.
5. Automatic take-profit and stop-loss
Whenever a valid signal occurs, the indicator automatically creates two boxes on the chart.
Piattaforma TradingView - Strumenti di Misurazione e Proiezione di un'operazione
Green
box
Take-profit zone.
Red
box
Stop-loss zone.
The boxes initially extend five candles into the future.
As price moves forward, the boxes continue extending until the take-profit or stop-loss is reached.
This makes it easy to visualize the potential trade without manually drawing risk/reward levels.
6. Risk management settings
The indicator has two stop-loss methods.
Option 1: ATR-based stop loss
Uses Average True Range to calculate the stop-loss distance.
For example:
ATR length: 14
Stop-loss multiplier: 1.5
Take-profit multiplier: 3.0
This means the stop loss is 1.5 ATR away from entry, and the take profit is 3 ATR away from entry.
Option 2: Signal candle high/low
BUY: Stop loss is placed at the signal candle's low.
SELL: Stop loss is placed at the signal candle's high.
The take-profit distance is calculated using the selected risk/reward ratio.
7. One trade at a time
This is one of the most important features.
The indicator uses trade management to prevent signals from continuously appearing while a previous trade is still active.
The process works like this:
1. Valid BUY or SELL signal appears
2. Entry, stop loss and take profit are calculated
3. Trade becomes active
No new signals are allowed.
Take profit hit
Trade closes.
Stop loss hit
Trade closes.
4. Indicator unlocks
It can now identify the next valid signal.
8. Indicator settings summary
Setting
Purpose
Previous Candle Direction
Same Direction or Mixed
Enable EMA Trend Filter
Turns EMA and trend filtering on/off
EMA Length
Controls EMA period
ATR Length
Controls ATR calculation
Stop Loss Method
ATR or Signal Candle High/Low
Stop Loss ATR Multiplier
Controls ATR stop distance
Risk/Reward Ratio
Controls reward relative to risk in candle-stop mode
Take Profit ATR Multiplier
Controls ATR target distance
Show Buy/Sell Signals
Displays signal labels
Show TP/SL Boxes
Displays trade zones
Initial Box Extension
Number of bars initially displayed ahead
9. The overall trading concept
The indicator is built around three main ideas:
Liquidity: Price takes out a previous candle's high or low.
Confirmation: Price reverses and engulfs the previous candle's range.
Trade management: The indicator plots entry, stop loss, and take profit while allowing only one active setup at a time.
The idea is to identify potential moves after liquidity has been taken, rather than entering simply because price touches a previous high or low.
One important distinction: This is a technical setup indicator, not proof that institutional liquidity was taken or that a reversal will occur. Signals are confirmed at candle close, and historical TP/SL results can be ambiguous when both levels fall within the same candle.
Also, the current script uses a fixed ATR target in ATR stop mode, while the signal-candle stop mode uses the R/R setting. These are two different target calculation methods.

免責聲明
這些資訊和出版物並非旨在提供,也不構成TradingView提供或認可的任何形式的財務、投資、交易或其他類型的建議或推薦。請閱讀使用條款以了解更多資訊。
免責聲明
這些資訊和出版物並非旨在提供,也不構成TradingView提供或認可的任何形式的財務、投資、交易或其他類型的建議或推薦。請閱讀使用條款以了解更多資訊。