OPEN-SOURCE SCRIPT
UCY-VWATR (live)
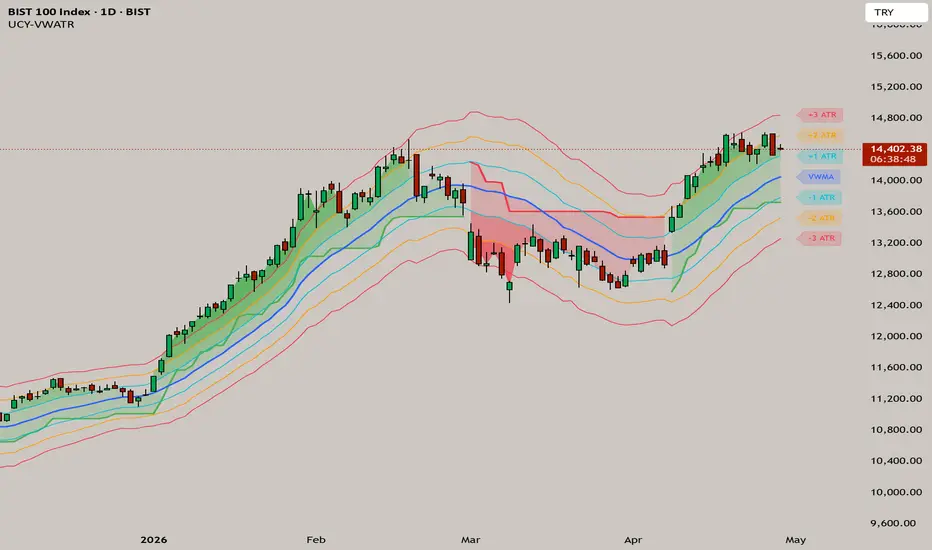
═══════════════════════════════════════
UCY-VWATR — Volume Weighted ATR Bands with Supertrend
═══════════════════════════════════════
▸ OVERVIEW
A volatility-band indicator that combines a Volume Weighted
Moving Average (VWMA) center line with ATR-based deviation
bands and a Supertrend overlay for trend direction.
The indicator visualizes how far price extends from its
volume-weighted mean in units of Average True Range, while
the Supertrend acts as a dynamic trend filter.
═══════════════════════════════════════
▸ HOW IT WORKS
- VWMA forms the central reference band (default: 20 period),
giving more weight to bars with higher volume than a standard
moving average.
- ATR (default: 14 period) generates three pairs of upper and
lower deviation bands at ±1, ±2, and ±3 multiples — mapping
volatility expansion zones around the mean.
- Supertrend (default: 10 period, factor 3.0) determines the
prevailing trend direction. Green = uptrend, Red = downtrend.
- Body-middle (the midpoint of each candle's open and close)
is compared against each band. When the body crosses beyond
a band in the direction of the active trend, a colored fill
appears — darker fills indicate stronger displacement from
the mean.
═══════════════════════════════════════
▸ HOW TO READ THE FILLS
In an UPTREND (green Supertrend):
- Body above VWMA → light green fill (mild momentum)
- Body above +1 ATR → medium green
- Body above +2 ATR → strong green
- Body above +3 ATR → extreme green (potential exhaustion)
In a DOWNTREND (red Supertrend):
- Body below VWMA → light red fill
- Body below -1 ATR → medium red
- Body below -2 ATR → strong red
- Body below -3 ATR → extreme red (potential exhaustion)
The intensity of the fill provides an at-a-glance read of
how stretched price is relative to its volume-weighted mean.
═══════════════════════════════════════
▸ POTENTIAL USE CASES
- Trend-following: Enter in the direction of the Supertrend
when price pulls back to VWMA or ±1 ATR band.
- Mean reversion: Look for exhaustion signals when price
reaches ±3 ATR bands against the prevailing trend.
- Breakout confirmation: A break and hold above/below ±1 ATR
in the direction of a fresh Supertrend flip can act as
trend confirmation.
- Volatility context: Wider band spacing signals high
volatility regimes; narrow bands indicate compression.
═══════════════════════════════════════
▸ SETTINGS
- VWMA Length: 20 (medium-term balance)
- ATR Length: 14 (classic Wilder period)
- ATR Multipliers: 1.0 / 2.0 / 3.0
- Supertrend ATR Length: 10
- Supertrend Factor: 3.0
All parameters are user-adjustable to fit different timeframes
and instruments. Lower multipliers suit ranging markets;
higher multipliers suit trending or volatile assets.
═══════════════════════════════════════
▸ NOTES
- Works on all timeframes and instruments (stocks, futures,
forex, crypto).
- VWMA requires volume data — best results on instruments
with reliable volume feeds (avoid forex spot pairs without
aggregated volume).
- Designed as a visual decision-support tool, not a
standalone signal generator.
═══════════════════════════════════════
⚠️ DISCLAIMER
This indicator is published for educational and analytical
purposes only. It does not constitute financial advice or a
recommendation to buy or sell any asset. All trading decisions
and their outcomes are the sole responsibility of the user.
Past performance does not guarantee future results.
UCY-VWATR — Volume Weighted ATR Bands with Supertrend
═══════════════════════════════════════
▸ OVERVIEW
A volatility-band indicator that combines a Volume Weighted
Moving Average (VWMA) center line with ATR-based deviation
bands and a Supertrend overlay for trend direction.
The indicator visualizes how far price extends from its
volume-weighted mean in units of Average True Range, while
the Supertrend acts as a dynamic trend filter.
═══════════════════════════════════════
▸ HOW IT WORKS
- VWMA forms the central reference band (default: 20 period),
giving more weight to bars with higher volume than a standard
moving average.
- ATR (default: 14 period) generates three pairs of upper and
lower deviation bands at ±1, ±2, and ±3 multiples — mapping
volatility expansion zones around the mean.
- Supertrend (default: 10 period, factor 3.0) determines the
prevailing trend direction. Green = uptrend, Red = downtrend.
- Body-middle (the midpoint of each candle's open and close)
is compared against each band. When the body crosses beyond
a band in the direction of the active trend, a colored fill
appears — darker fills indicate stronger displacement from
the mean.
═══════════════════════════════════════
▸ HOW TO READ THE FILLS
In an UPTREND (green Supertrend):
- Body above VWMA → light green fill (mild momentum)
- Body above +1 ATR → medium green
- Body above +2 ATR → strong green
- Body above +3 ATR → extreme green (potential exhaustion)
In a DOWNTREND (red Supertrend):
- Body below VWMA → light red fill
- Body below -1 ATR → medium red
- Body below -2 ATR → strong red
- Body below -3 ATR → extreme red (potential exhaustion)
The intensity of the fill provides an at-a-glance read of
how stretched price is relative to its volume-weighted mean.
═══════════════════════════════════════
▸ POTENTIAL USE CASES
- Trend-following: Enter in the direction of the Supertrend
when price pulls back to VWMA or ±1 ATR band.
- Mean reversion: Look for exhaustion signals when price
reaches ±3 ATR bands against the prevailing trend.
- Breakout confirmation: A break and hold above/below ±1 ATR
in the direction of a fresh Supertrend flip can act as
trend confirmation.
- Volatility context: Wider band spacing signals high
volatility regimes; narrow bands indicate compression.
═══════════════════════════════════════
▸ SETTINGS
- VWMA Length: 20 (medium-term balance)
- ATR Length: 14 (classic Wilder period)
- ATR Multipliers: 1.0 / 2.0 / 3.0
- Supertrend ATR Length: 10
- Supertrend Factor: 3.0
All parameters are user-adjustable to fit different timeframes
and instruments. Lower multipliers suit ranging markets;
higher multipliers suit trending or volatile assets.
═══════════════════════════════════════
▸ NOTES
- Works on all timeframes and instruments (stocks, futures,
forex, crypto).
- VWMA requires volume data — best results on instruments
with reliable volume feeds (avoid forex spot pairs without
aggregated volume).
- Designed as a visual decision-support tool, not a
standalone signal generator.
═══════════════════════════════════════
⚠️ DISCLAIMER
This indicator is published for educational and analytical
purposes only. It does not constitute financial advice or a
recommendation to buy or sell any asset. All trading decisions
and their outcomes are the sole responsibility of the user.
Past performance does not guarantee future results.
開源腳本
秉持TradingView一貫精神,這個腳本的創作者將其設為開源,以便交易者檢視並驗證其功能。向作者致敬!您可以免費使用此腳本,但請注意,重新發佈代碼需遵守我們的社群規範。

免責聲明
這些資訊和出版物並非旨在提供,也不構成TradingView提供或認可的任何形式的財務、投資、交易或其他類型的建議或推薦。請閱讀使用條款以了解更多資訊。
開源腳本
秉持TradingView一貫精神,這個腳本的創作者將其設為開源,以便交易者檢視並驗證其功能。向作者致敬!您可以免費使用此腳本,但請注意,重新發佈代碼需遵守我們的社群規範。
免責聲明
這些資訊和出版物並非旨在提供,也不構成TradingView提供或認可的任何形式的財務、投資、交易或其他類型的建議或推薦。請閱讀使用條款以了解更多資訊。