OPEN-SOURCE SCRIPT
已更新 Volume Anomaly Reversal Detection
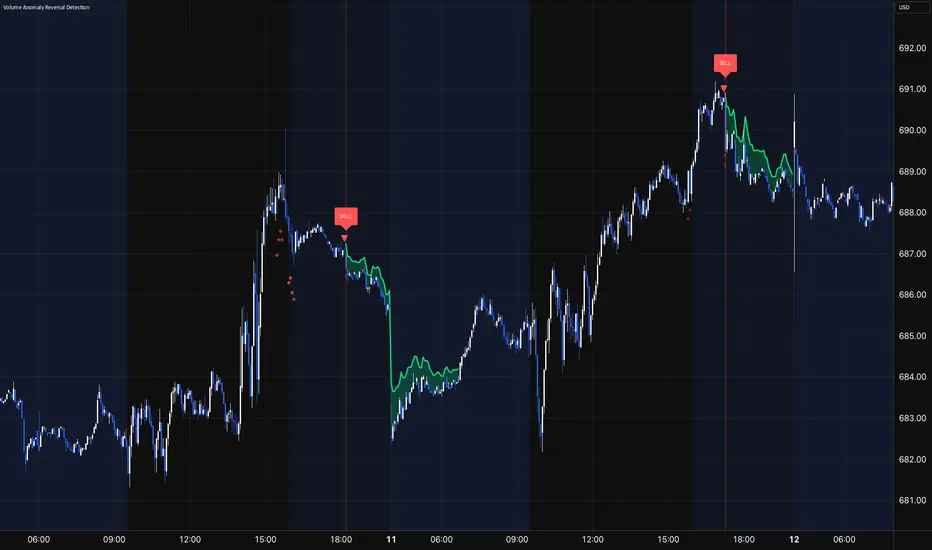
Volume Anomaly Reversal Detection (VARD System)
🎯 What This Indicator Does
This indicator identifies potential trend reversals by detecting abnormal volume activity that often precedes significant price movements. It combines volume anomaly detection with dynamic trend analysis to generate actionable BUY/SELL signals.
📊 Core Concept & Methodology
Volume Anomaly Detection
The indicator analyzes directional volume (buying vs selling pressure) from a lower timeframe and calculates Z-scores to identify statistically significant volume spikes.
Z-Score Formula:
Z = (Current Volume - Average Volume) / Standard Deviation
When volume exceeds the threshold (default: 3 standard deviations above mean), it signals unusual market activity - often caused by forced liquidations or capitulation.
Dynamic Trend Filter
A custom trend-following algorithm based on ATR (Average True Range) bands determines the current market direction:
Price above lower band = Uptrend
Price below upper band = Downtrend
Signal Logic
Volume anomaly detected during an existing trend
Trend reversal confirmed within the confirmation window
Signal generated = BUY or SELL label appears
⚙️ Settings Explained
SettingDefaultDescriptionAnalysis Timeframe15minLower timeframe for volume samplingStatistical Lookback200Bars used for Z-score calculationAnomaly Sensitivity3.0Z-score threshold (lower = more signals)Confirmation Window50Max bars between anomaly and trend flipATR Multiplier2.0Trend band widthTrend Period10ATR calculation length
📖 How To Use
Entry Signals
BUY: Green label appears below bar - consider long positions
SELL: Red label appears above bar - consider short positions
Volume Anomaly Markers (⬥)
Small diamonds indicate detected volume spikes
These are early warnings before confirmed signals
Useful for anticipating potential reversals
Trend Bands
Colored zones show active signal direction
Stay with the trend until opposite signal appears
Best Practices
Confirm with price action - Look for support/resistance levels
Use appropriate timeframes - Works on all timeframes, but 1H-4H recommended
Manage risk - Always use stop losses
Avoid ranging markets - Best in trending/volatile conditions
⚠️ Important Notes
No indicator is perfect - Use as part of a complete trading strategy
Volume data required - Will show warning if volume unavailable
Not financial advice - Always do your own research
🔔 Alerts Available
BUY Signal Confirmed
SELL Signal Confirmed
Volume Anomaly (Buy Setup)
Volume Anomaly (Sell Setup)
發行說明
Fix bugs發行說明
Fix signals style and bugs開源腳本
秉持TradingView一貫精神,這個腳本的創作者將其設為開源,以便交易者檢視並驗證其功能。向作者致敬!您可以免費使用此腳本,但請注意,重新發佈代碼需遵守我們的社群規範。

Nothing
免責聲明
這些資訊和出版物並非旨在提供,也不構成TradingView提供或認可的任何形式的財務、投資、交易或其他類型的建議或推薦。請閱讀使用條款以了解更多資訊。
開源腳本
秉持TradingView一貫精神,這個腳本的創作者將其設為開源,以便交易者檢視並驗證其功能。向作者致敬!您可以免費使用此腳本,但請注意,重新發佈代碼需遵守我們的社群規範。
Nothing
免責聲明
這些資訊和出版物並非旨在提供,也不構成TradingView提供或認可的任何形式的財務、投資、交易或其他類型的建議或推薦。請閱讀使用條款以了解更多資訊。