ATR & Daily Range
# ATR & Daily Range Dashboard
**Overview**
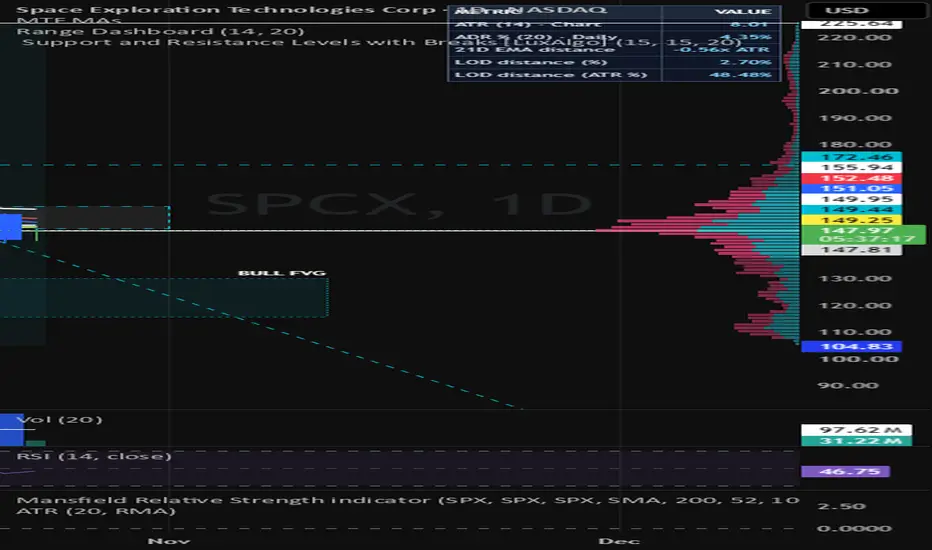
The ATR & Daily Range Dashboard is a TradingView indicator designed to help traders evaluate price volatility, daily trading ranges, and price extension relative to key technical reference levels.
The indicator displays up to five customizable metrics in a compact table positioned in the upper-right corner of the chart. It combines Average True Range (ATR), Average Daily Range (ADR), distance from the 21-day Exponential Moving Average (EMA), and two methods for measuring price distance from the current day's low.
The dashboard is intended for intraday and swing traders who want a quick, quantitative assessment of price movement without switching between indicators or performing manual calculations.
## Key Features
### 1. Average True Range (ATR)
Measures the average price movement, including gaps, over a configurable number of bars using Wilder's ATR calculation.
- **Default period:** 14
- **Timeframe:** Current chart timeframe
- **Display:** Price units (e.g., $4.35)
- **Purpose:** Evaluate normal volatility and the magnitude of price movement.
ATR automatically adjusts to the selected chart timeframe. For example, on a daily chart it represents daily ATR, while on a 30-minute chart it represents 30-minute ATR.
### 2. Average Daily Range (ADR %)
Measures the average daily high-to-low trading range, expressed as a percentage of each day's closing price.
**Formula:**
ADR % = Average of [(Daily High − Daily Low) / Daily Close × 100]
- **Default period:** 14 days
- **Timeframe:** Daily, regardless of chart timeframe
- **Display:** Percentage (e.g., 3.20%)
- **Purpose:** Understand a stock's typical daily trading range relative to its price.
Unlike ATR, ADR does not include overnight gaps in its individual daily high-to-low range measurements.
### 3. Distance from the 21-Day EMA
Measures the distance between the current market price and the 21-day Exponential Moving Average, expressed in ATR multiples.
**Formula:**
EMA Distance = (Current Price − 21-Day EMA) / Chart ATR
- **EMA period:** Fixed at 21 daily bars
- **ATR period:** User-configurable
- **Display:** ATR multiple (e.g., +1.06x ATR)
- **Purpose:** Identify how far price is trading above or below its intermediate-term trend reference.
**Interpretation:**
- Positive values indicate price is above the 21-day EMA.
- Negative values indicate price is below the 21-day EMA.
- Larger absolute values indicate greater distance relative to the selected chart timeframe's ATR.
**Important:** The EMA is calculated on the daily timeframe, but the denominator uses the selected chart timeframe's ATR. Consequently, values will differ between intraday and daily charts.
### 4. Low of Day Distance (%)
Measures how far the current price is above the lowest price reached during the trading day, expressed as a percentage of that low.
**Formula:**
LOD Distance (%) = [(Current Price − Low of Day) / Low of Day] × 100
**Example:**
- Current price: $152.00
- Low of Day: $148.00
- LOD Distance: 2.70%
**Purpose:** Quantify the percentage recovery or advance from the day's low.
A higher percentage indicates that price has traveled farther from its intraday minimum. This metric is particularly useful when evaluating intraday reversals, recoveries, and potential entry extensions.
### 5. Low of Day Distance (ATR %)
Measures the distance between the current price and the Low of Day as a percentage of the stock's Daily ATR.
**Formula:**
LOD Distance (ATR %) = [(Current Price − Low of Day) / Daily ATR] × 100
**Example:**
- Current price: $152.00
- Low of Day: $148.00
- Daily ATR(14): $5.00
- LOD Distance (ATR %): 80.00%
**Interpretation:**
- 25% = Price has moved 0.25 daily ATR above the day's low.
- 50% = Price has moved 0.50 daily ATR above the day's low.
- 100% = Price has moved 1.00 daily ATR above the day's low.
- 150% = Price has moved 1.50 daily ATR above the day's low.
**Purpose:** Normalize intraday price movement against the stock's typical daily volatility, allowing more meaningful comparisons between securities with different prices and volatility profiles.
Unlike LOD Distance (%), this metric helps distinguish between a normal intraday recovery and a potentially extended move relative to historical volatility.
## Customization
All five metrics can be independently enabled or disabled through the indicator's **Display** settings.
Users can display LOD Distance (%) only, LOD Distance (ATR %) only, both simultaneously, or neither.
The ATR and ADR calculation periods are configurable independently, with a default of 14 periods each.
The dashboard automatically adjusts its number of rows based on the enabled metrics.
## Timeframe Behavior
| Metric | Calculation timeframe |
|---|---|
| ATR | Selected chart timeframe |
| ADR % | Daily |
| 21D EMA Distance | Daily EMA / Chart ATR |
| LOD Distance (%) | Current trading day |
| LOD Distance (ATR %) | Current trading day / Daily ATR |
The indicator can be applied to intraday, daily, and higher-timeframe charts. However, the LOD metrics are designed primarily for intraday and daily analysis. On higher-timeframe charts, the requested daily low does not necessarily represent the low of the entire higher-timeframe bar.
On intraday charts, the indicator accumulates the lowest price observed since the start of the chart's current daily period. The bars and session settings of the chart determine which price activity is included.
## Practical Trading Applications
**Intraday Reversals:** Evaluate how far a stock has recovered from its session low and whether the move has already consumed a substantial portion of its typical daily volatility.
**Breakouts:** Assess price extension before entering a breakout or continuation trade. A large LOD ATR percentage may indicate that a considerable price move has already occurred.
**Pullbacks:** Compare the distance from the 21-day EMA with the intraday distance from the day's low to provide context for entry location.
**Volatility Comparison:** Use ADR% and LOD ATR% to compare price movement across stocks with different share prices and volatility characteristics.
**Risk Management:** Support stop-distance evaluation and entry discipline by identifying unusually large moves relative to average volatility. These measurements provide context but do not independently determine appropriate stop placements.
## Technical Characteristics
- Developed in Pine Script version 6.
- Displays a compact two-column table in the chart's upper-right corner.
- Uses Wilder's ATR calculation.
- Calculates daily metrics through TradingView's `request.security()` function.
- Tracks the current day's low on intraday charts.
- Uses `barmerge.lookahead_off` to avoid historical future-data leakage.
- Updates the dashboard on the latest chart bar.
- Supports independently configurable ATR and ADR periods.
- Includes safeguards against division by zero and unavailable calculations.
- Displays `N/A` when required data is unavailable.
- Does not generate automatic buy or sell signals.
- Does not place orders or manage positions.
**Data consideration:** Daily values can change while the daily candle is developing. On historical intraday bars, TradingView's higher-timeframe data alignment may produce differences between displayed historical values and those observed during live trading.
## Intended Use
The ATR & Daily Range Dashboard is a decision-support indicator, not a standalone trading strategy.
Its primary purpose is to provide an immediate view of volatility, price extension, and intraday movement so traders can evaluate trade locations, recognize potentially extended moves, and make more consistent, rules-based decisions.
It is especially suited to traders using technical setups such as breakouts, pullbacks, moving-average reclaims, and intraday reversals.
**Overview**
The ATR & Daily Range Dashboard is a TradingView indicator designed to help traders evaluate price volatility, daily trading ranges, and price extension relative to key technical reference levels.
The indicator displays up to five customizable metrics in a compact table positioned in the upper-right corner of the chart. It combines Average True Range (ATR), Average Daily Range (ADR), distance from the 21-day Exponential Moving Average (EMA), and two methods for measuring price distance from the current day's low.
The dashboard is intended for intraday and swing traders who want a quick, quantitative assessment of price movement without switching between indicators or performing manual calculations.
## Key Features
### 1. Average True Range (ATR)
Measures the average price movement, including gaps, over a configurable number of bars using Wilder's ATR calculation.
- **Default period:** 14
- **Timeframe:** Current chart timeframe
- **Display:** Price units (e.g., $4.35)
- **Purpose:** Evaluate normal volatility and the magnitude of price movement.
ATR automatically adjusts to the selected chart timeframe. For example, on a daily chart it represents daily ATR, while on a 30-minute chart it represents 30-minute ATR.
### 2. Average Daily Range (ADR %)
Measures the average daily high-to-low trading range, expressed as a percentage of each day's closing price.
**Formula:**
ADR % = Average of [(Daily High − Daily Low) / Daily Close × 100]
- **Default period:** 14 days
- **Timeframe:** Daily, regardless of chart timeframe
- **Display:** Percentage (e.g., 3.20%)
- **Purpose:** Understand a stock's typical daily trading range relative to its price.
Unlike ATR, ADR does not include overnight gaps in its individual daily high-to-low range measurements.
### 3. Distance from the 21-Day EMA
Measures the distance between the current market price and the 21-day Exponential Moving Average, expressed in ATR multiples.
**Formula:**
EMA Distance = (Current Price − 21-Day EMA) / Chart ATR
- **EMA period:** Fixed at 21 daily bars
- **ATR period:** User-configurable
- **Display:** ATR multiple (e.g., +1.06x ATR)
- **Purpose:** Identify how far price is trading above or below its intermediate-term trend reference.
**Interpretation:**
- Positive values indicate price is above the 21-day EMA.
- Negative values indicate price is below the 21-day EMA.
- Larger absolute values indicate greater distance relative to the selected chart timeframe's ATR.
**Important:** The EMA is calculated on the daily timeframe, but the denominator uses the selected chart timeframe's ATR. Consequently, values will differ between intraday and daily charts.
### 4. Low of Day Distance (%)
Measures how far the current price is above the lowest price reached during the trading day, expressed as a percentage of that low.
**Formula:**
LOD Distance (%) = [(Current Price − Low of Day) / Low of Day] × 100
**Example:**
- Current price: $152.00
- Low of Day: $148.00
- LOD Distance: 2.70%
**Purpose:** Quantify the percentage recovery or advance from the day's low.
A higher percentage indicates that price has traveled farther from its intraday minimum. This metric is particularly useful when evaluating intraday reversals, recoveries, and potential entry extensions.
### 5. Low of Day Distance (ATR %)
Measures the distance between the current price and the Low of Day as a percentage of the stock's Daily ATR.
**Formula:**
LOD Distance (ATR %) = [(Current Price − Low of Day) / Daily ATR] × 100
**Example:**
- Current price: $152.00
- Low of Day: $148.00
- Daily ATR(14): $5.00
- LOD Distance (ATR %): 80.00%
**Interpretation:**
- 25% = Price has moved 0.25 daily ATR above the day's low.
- 50% = Price has moved 0.50 daily ATR above the day's low.
- 100% = Price has moved 1.00 daily ATR above the day's low.
- 150% = Price has moved 1.50 daily ATR above the day's low.
**Purpose:** Normalize intraday price movement against the stock's typical daily volatility, allowing more meaningful comparisons between securities with different prices and volatility profiles.
Unlike LOD Distance (%), this metric helps distinguish between a normal intraday recovery and a potentially extended move relative to historical volatility.
## Customization
All five metrics can be independently enabled or disabled through the indicator's **Display** settings.
Users can display LOD Distance (%) only, LOD Distance (ATR %) only, both simultaneously, or neither.
The ATR and ADR calculation periods are configurable independently, with a default of 14 periods each.
The dashboard automatically adjusts its number of rows based on the enabled metrics.
## Timeframe Behavior
| Metric | Calculation timeframe |
|---|---|
| ATR | Selected chart timeframe |
| ADR % | Daily |
| 21D EMA Distance | Daily EMA / Chart ATR |
| LOD Distance (%) | Current trading day |
| LOD Distance (ATR %) | Current trading day / Daily ATR |
The indicator can be applied to intraday, daily, and higher-timeframe charts. However, the LOD metrics are designed primarily for intraday and daily analysis. On higher-timeframe charts, the requested daily low does not necessarily represent the low of the entire higher-timeframe bar.
On intraday charts, the indicator accumulates the lowest price observed since the start of the chart's current daily period. The bars and session settings of the chart determine which price activity is included.
## Practical Trading Applications
**Intraday Reversals:** Evaluate how far a stock has recovered from its session low and whether the move has already consumed a substantial portion of its typical daily volatility.
**Breakouts:** Assess price extension before entering a breakout or continuation trade. A large LOD ATR percentage may indicate that a considerable price move has already occurred.
**Pullbacks:** Compare the distance from the 21-day EMA with the intraday distance from the day's low to provide context for entry location.
**Volatility Comparison:** Use ADR% and LOD ATR% to compare price movement across stocks with different share prices and volatility characteristics.
**Risk Management:** Support stop-distance evaluation and entry discipline by identifying unusually large moves relative to average volatility. These measurements provide context but do not independently determine appropriate stop placements.
## Technical Characteristics
- Developed in Pine Script version 6.
- Displays a compact two-column table in the chart's upper-right corner.
- Uses Wilder's ATR calculation.
- Calculates daily metrics through TradingView's `request.security()` function.
- Tracks the current day's low on intraday charts.
- Uses `barmerge.lookahead_off` to avoid historical future-data leakage.
- Updates the dashboard on the latest chart bar.
- Supports independently configurable ATR and ADR periods.
- Includes safeguards against division by zero and unavailable calculations.
- Displays `N/A` when required data is unavailable.
- Does not generate automatic buy or sell signals.
- Does not place orders or manage positions.
**Data consideration:** Daily values can change while the daily candle is developing. On historical intraday bars, TradingView's higher-timeframe data alignment may produce differences between displayed historical values and those observed during live trading.
## Intended Use
The ATR & Daily Range Dashboard is a decision-support indicator, not a standalone trading strategy.
Its primary purpose is to provide an immediate view of volatility, price extension, and intraday movement so traders can evaluate trade locations, recognize potentially extended moves, and make more consistent, rules-based decisions.
It is especially suited to traders using technical setups such as breakouts, pullbacks, moving-average reclaims, and intraday reversals.

免責聲明
這些資訊和出版物並非旨在提供,也不構成TradingView提供或認可的任何形式的財務、投資、交易或其他類型的建議或推薦。請閱讀使用條款以了解更多資訊。