已更新
My script
Implied Volatility vs Historical Volatility
**Uncheck Plot box**
**Uncheck Plot box**
- IV > HV = Overvalued
- IV = HV = Fair Value
- IV > HV = Undervalued
- 1. Pair with IV Rank: Use IV vs HV to confirm the setup, but IV Rank (50+, 70+) tells you how “high” IV is relative to its own history.
- 2. Timeframe: Use daily charts — IV is not meaningful on intraday timeframes.
- 3. Avoid noise: Use a smoothed HV (e.g., 20-day) and don’t chase small crossovers — look for clear divergence.
發行說明
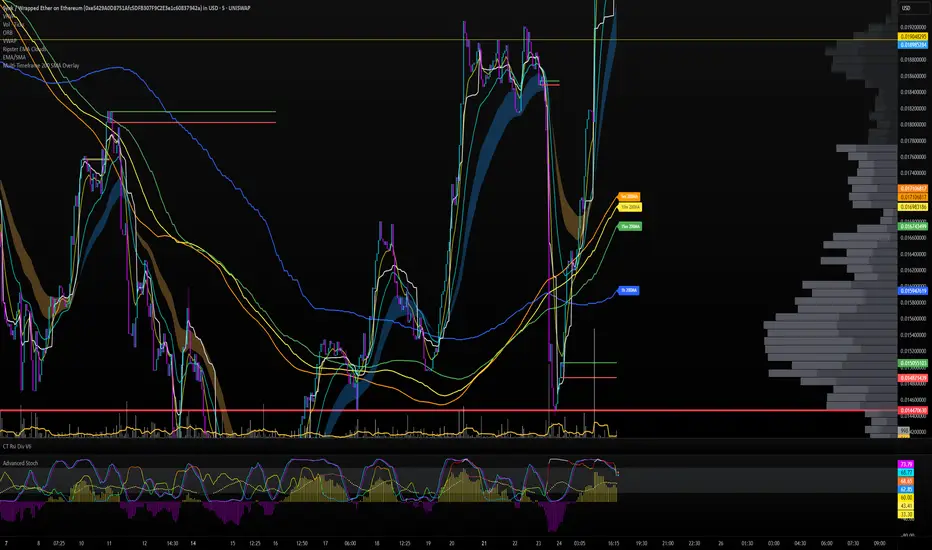
The Essential 200 MAs to watch in your day trading: 200 simple moving average for:5 minute
10 minute
15 minute
1 hour

免責聲明
這些資訊和出版物並非旨在提供,也不構成TradingView提供或認可的任何形式的財務、投資、交易或其他類型的建議或推薦。請閱讀使用條款以了解更多資訊。
免責聲明
這些資訊和出版物並非旨在提供,也不構成TradingView提供或認可的任何形式的財務、投資、交易或其他類型的建議或推薦。請閱讀使用條款以了解更多資訊。