Viprasol Z-Score & Stats
🔵 OVERVIEW
🔵 WHY THESE READINGS ARE COMBINED
🔵 WHAT IS ORIGINAL
🔵 HOW IT WORKS
🔵 KEY FEATURES
🔵 HOW TO USE
🔵 SETTINGS
🔵 ALERTS
🔵 LIMITATIONS & DISCLAIMER
🔵 HOUSE RULES & PURPOSE
Published open-source by Viprasol.
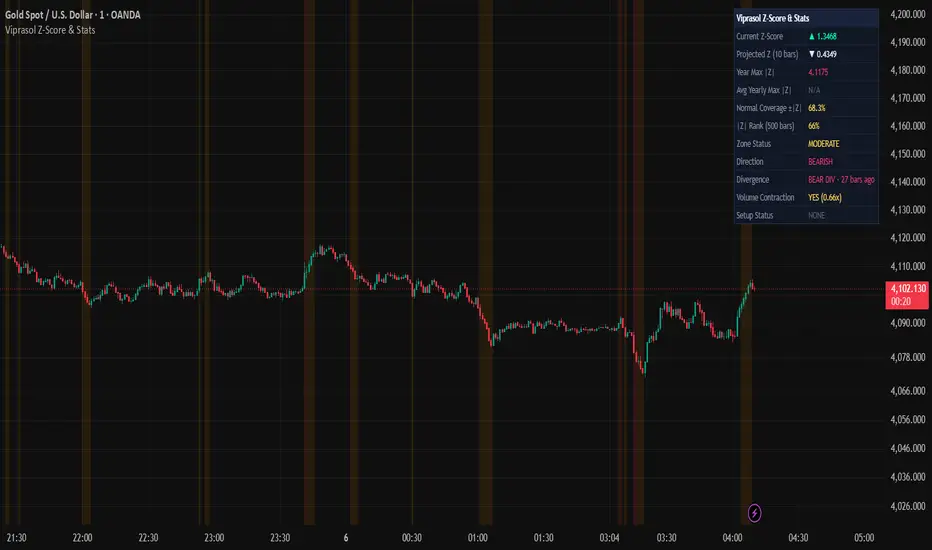
Viprasol Z-Score & Stats shows how far the source (close by default) sits from its recent mean, in standard deviations, and puts that reading in context. The z-score line is coloured by its band (±1, ±2, ±3 SD) and the pane is shaded beyond ±2 and ±3. Small marks show where the z-score first reaches ±3.5 and where it closes back inside the ±2.5 band. Divergences between z-score pivots and the source are drawn as lines with BULL / BEAR labels, and an arrow projects the z-score a few bars ahead from its latest change. A statistics table adds the year's extreme readings, how unusual the current reading would be under a normal curve, how unusual it is in this market's own recent history, and whether volume is contracting.
It is built for traders who use statistical stretch and mean reversion as context on any market and timeframe, and want the "how extreme is this?" question answered in one pane.
🔵 WHY THESE READINGS ARE COMBINED
- A z-score alone has no scale of rarity. A reading of 2.3 means little until it is compared with something. The table compares it three ways: with a textbook normal curve, with this market's last 500 bars, and with the largest readings of past calendar years. All three come from the same z-score series, so they answer one question from three angles.
- A normal curve alone is misleading for prices. Market z-scores reach the outer bands more often than a normal curve suggests (fat tails), which is why the |Z| Rank row compares |z| with the symbol's own history. The two read-outs sit side by side.
- Extremes and their unwinding are different events. The ±3.5 mark shows when the stretch begins; the re-entry mark shows when the z-score closes back inside the band. Divergences add whether a new price extreme came with a weaker z-score extreme.
- Participation matters at an extreme. The volume read-out shows whether an extreme z-score happens while volume is contracted (below 0.7 x its 20-bar average), which the Setup Status row and two alerts combine.
🔵 WHAT IS ORIGINAL
- Two measures of rarity side by side: the stepped normal-curve coverage of ±|z| next to an empirical rank of |z| over the last 500 bars of the same symbol and timeframe, so a trader can see when the textbook number and the market's own history disagree.
- Calendar-year extreme statistics: Year Max |Z| and Avg Yearly Max |Z| are measured over real calendar years instead of a fixed bar count (the chart's first, partial year is skipped). Avg Yearly Max needs at least one complete calendar year (1 Jan-31 Dec) loaded; Year Max covers the loaded part of the current year. On 1m-15m charts use Fixed bar count, the classic 252-bar blocks.
- Band re-entry marks with spacing: a mark on the bar the z-score closes back inside ±2.5 after being beyond it, at least 10 bars apart, with alerts.
- Spaced divergences with a persistent read-out: divergence marks are at least 10 bars apart, and the table keeps the latest divergence with its age instead of showing it only on the bar it was found.
🔵 HOW IT WORKS
Z-score, then bands and extremes, then re-entry and divergence marks, then the projection and the statistics table. Re-entry marks and every alert condition are decided on closed bars. The ±3.5 marks, divergences, table, Z label and arrow also follow the live bar and settle when it closes.
1 — Rolling Z-ScorePine Script®
- Bounded by design: the current bar is part of its own window, so |z| can never exceed (N - 1) / √N, about 4.25 at the default 20. Readings near ±4 are therefore very rare. With a lookback of 14 or less, ±3.5 can never be reached (no ±3.5 marks, ±3.5 alerts or Setup Status); with 17 or less, ±4.0 cannot.
2 — Bands, Zones and ExtremesPine Script®
3 — Band Re-entry MarksPine Script®
- Reading it: the mark describes the z-score returning toward its mean after a stretch. It is not a buy or sell call; price can stretch again right after it.
4 — DivergencesPine Script®
- Drawing: a line joins the two z-score pivots and a small label marks the newer one. Hidden divergences use dashed lines and are off by default.
- Source values: the source is read on the two z-score pivot bars, so "lower low" means a lower source value at the newer z-score pivot.
5 — Direction ModelPine Script®
- Arrow: drawn from the last bar to the projected value. It extends the latest one-bar change; it is an extrapolation, not a forecast.
- Direction row: BULLISH / BEARISH is the direction of the projected z-score (rising from below 0 / falling from above 0). It describes the z-score, not a call on the market.
6 — Statistics TablePine Script®
- Normal Coverage: 95.4% means 95.4% of a normal distribution lies within ±2 SD, so the reading would sit in the outer 4.6%. It describes how unusual the reading is under that assumption; it is not a probability that price will revert.
- Yearly rows: Avg Yearly Max needs at least one complete calendar year (1 Jan-31 Dec) loaded; Year Max covers the loaded part of the current year. On 1m-15m charts use Fixed bar count.
- Other rows: current z-score, projected z-score, zone status, direction, the latest divergence with its age, and the volume ratio (NO VOLUME DATA on symbols without volume).
- Reading the table: each value is coloured by its state: pink-red for extreme or bearish, amber for elevated, green for calm or bullish, grey for none; z-score values inside ±1 SD are white.
🔵 KEY FEATURES
- Rolling z-score: sample standard deviation over an adjustable lookback, with ±1 / ±2 / ±3 SD bands and zone status
- Extreme marks: the first bar at or beyond ±3.5 SD
- Band re-entry marks: the close back inside ±2.5 SD, at least 10 bars apart
- Divergences: regular divergences between z-score pivots and the source, optional hidden divergences, at least 10 bars apart
- Direction model: a capped momentum projection of the z-score with a BULLISH / BEARISH / NEUTRAL read-out
- Rarity statistics: calendar-year extremes, normal-curve coverage and an empirical |z| rank
- Volume context: volume contraction at extreme readings
- Alerts: ten alert conditions plus one combined alert() message
🔵 HOW TO USE
Setup
- Chart: any symbol, standard candlesticks, 1m to 1D. Volume rows need a symbol with volume data.
- Defaults: lookback 20, calendar-year statistics, rank over 500 bars, re-entry level 2.5 with 10 bars between marks, regular divergences only with 10 bars between marks, volume contraction below 0.7 x the 20-bar average.
Reading the Chart
- Coloured line and shading: the band the z-score is in; orange and red shading beyond ±2 and ±3.
- Red / green x: the z-score first reached +3.5 / -3.5.
- Small triangle: the z-score closed back inside ±2.5 (down triangle from above, up triangle from below).
- BULL / BEAR with a line: a divergence between two z-score pivots and the source.
- Arrow and Z label: the projection and the current value at the last bar.
Recommended Starting Points
- Scalping (1m-5m): lookback 20-30, re-entry level 2.5, divergence spacing 10-15, Yearly Stats Period Fixed bar count
- Intraday (15m-1H): defaults; on 15m set Yearly Stats Period to Fixed bar count
- Swing (4H-1D): lookback 20-50; on daily stock charts the fixed 252-bar period gives the classic yearly blocks
These are starting points only. Test on historical data and adjust before trading live.
🔵 SETTINGS
- General: source, lookback period, yearly stats period (calendar year or fixed bar count), bars per year, |Z| rank lookback.
- Volume Contraction: volume MA length, contraction threshold.
- Direction Model: show direction arrow, projection bars, momentum factor.
- Divergence: show divergences, pivot lookback, maximum and minimum divergence range, divergence colours, show hidden divergences, minimum bars between divergences.
- Cross Marks: show cross marks at ±3.5 SD.
- Band Re-entry: show band re-entry marks, re-entry level, minimum bars between marks.
- Colors and Fill Colors: z-score line colouring (zone colours or single colour), line, band and fill colours.
- Table Settings: table position, table size (tiny, small, normal or large; small by default).
- Alerts: z-score alert on bar close.
🔵 ALERTS
- Z at +3.5 / Z at -3.5: the z-score closed at or beyond ±3.5 after being inside on the previous bar
- Z at +4.0 / Z at -4.0: the same at ±4.0
- Re-entry Below +Level / Re-entry Above -Level: a band re-entry mark
- Bullish / Bearish Divergence: a divergence mark
- Oversold / Overbought Extreme + Low Volume: the first bar with |z| at or beyond 3.5 while volume is contracted
- Any alert() function call: one message listing every ±3.5 / ±4.0 crossing on the bar, with symbol, timeframe and the current z-score; sent on the bar close by default
All alert conditions include {{ticker}}, {{interval}} and {{close}} placeholders and are evaluated on closed bars.
🔵 LIMITATIONS & DISCLAIMER
- A statistic, not a forecast: the z-score describes where the source sits relative to its own recent mean. A stretched reading can stay stretched or stretch further in a trend.
- Not normally distributed: the normal-curve coverage is a reference only. Use the |Z| Rank row to see how rare a reading is on the chart's own history.
- Late by design: divergences are confirmed after the pivot lookback (5 bars by default), so they appear after the pivot bar, never on it.
- History matters: Avg Yearly Max needs at least one complete calendar year (1 Jan-31 Dec) loaded and shows N/A until then; Year Max covers the loaded part of the current year. On 1m-15m charts use Fixed bar count.
- Rank needs history: |Z| Rank needs as many bars as the |Z| Rank Lookback (500 by default), so short histories show N/A; lower the Rank Lookback there.
- Volume quality varies: spot forex and many CFD feeds report tick volume, and some indices report none; the table then shows NO VOLUME DATA and the volume alerts cannot fire.
- No guarantees: past behaviour of any reading or mark does not guarantee future results. Always use proper risk management and do your own analysis before trading.
🔵 HOUSE RULES & PURPOSE
- Educational purpose only: this indicator is published for educational and analytical purposes. It is not financial advice, not a trading recommendation and not a solicitation to buy or sell any asset. Nothing on the chart, in the table or in the alerts should be taken as a promise of results.
- TradingView House Rules: this script is published open-source and in line with the TradingView House Rules. The description explains how every mark, statistic and read-out is calculated, makes no performance or win-rate claims, uses standard candlestick charts only, and the chart shown is clean with the symbol and timeframe visible.
- Your responsibility: test the indicator on historical data, understand each setting before changing it, and never risk more than you can afford to lose.
Published open-source by Viprasol.

Trading-systems engineers. We build custom MT4/MT5 expert advisors, prop-firm-compliant EAs, TradingView indicators, Pine-to-MQL5 ports and webhook-to-broker bridges. Backtested, forward-tested, source code yours. viprasol.com · WhatsApp +91 96336 52112
免責聲明
這些資訊和出版物並非旨在提供,也不構成TradingView提供或認可的任何形式的財務、投資、交易或其他類型的建議或推薦。請閱讀使用條款以了解更多資訊。
Trading-systems engineers. We build custom MT4/MT5 expert advisors, prop-firm-compliant EAs, TradingView indicators, Pine-to-MQL5 ports and webhook-to-broker bridges. Backtested, forward-tested, source code yours. viprasol.com · WhatsApp +91 96336 52112
免責聲明
這些資訊和出版物並非旨在提供,也不構成TradingView提供或認可的任何形式的財務、投資、交易或其他類型的建議或推薦。請閱讀使用條款以了解更多資訊。