EWS - Anchored VWAP Indicator
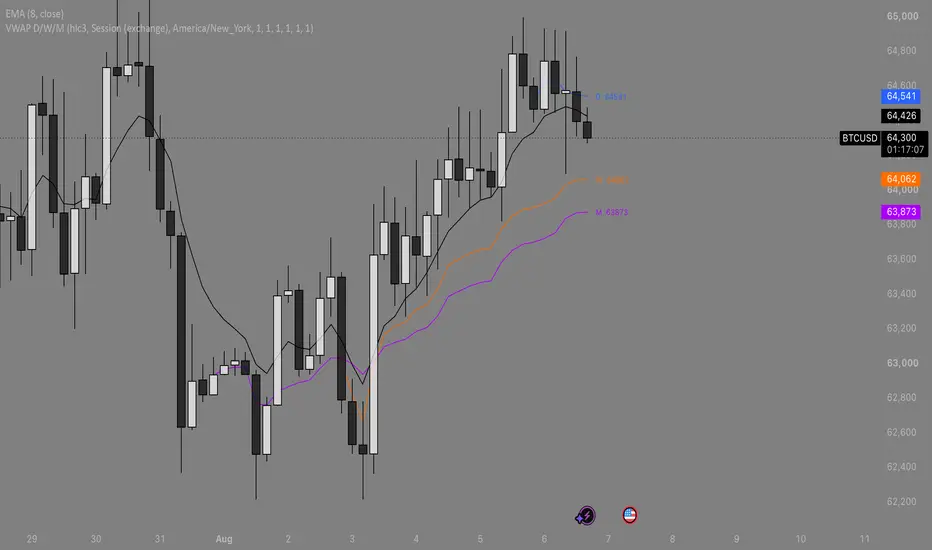
VWAP — Daily / Weekly / Monthly
Three independently anchored volume weighted average prices on one chart. Each
one resets on the first tick of a new day, week and month, so you always see
where the daily, weekly and monthly volume has actually been transacted rather
than a single rolling average.
WHAT IT DOES
VWAP is the average price of every trade in a period, weighted by size. It is
the reference price large orders are measured against, which is why price so
often gravitates back to it. A daily VWAP tells you who is winning the session,
a weekly VWAP frames the swing, and a monthly VWAP marks the level that
positional money is anchored to. Having all three at once shows you when they
stack up (trend) and when they pinch together (compression before expansion).
Each VWAP is accumulated bar by bar from the raw price and volume of the chart
you are on. Nothing is smoothed, averaged again, or borrowed from a higher
timeframe request, so there is no repainting and no lag beyond the data itself.
ANCHORING
The whole point of a periodic VWAP is where it resets, so the anchor is
configurable rather than assumed.
Session (exchange) resets when TradingView opens a new daily, weekly or monthly
bar. This respects the symbol's real session, so a futures day correctly begins
at 18:00 the previous evening and a stock day begins at the opening bell. This
matches the behaviour of the built-in VWAP.
Calendar resets at 00:00 in a timezone you choose: the exchange timezone, UTC,
or any IANA timezone you type in. This is normally what you want on 24/7 crypto,
where there is no session and the market convention is a UTC day.
Pick the mode that matches how you actually think about the instrument. For
crypto, Calendar UTC. For futures, FX and equities, Session.
FEATURES
Daily, weekly and monthly VWAP, each with its own colour, line width and
on/off switch.
Optional standard deviation bands on any of the three, with a configurable
multiplier and a shaded fill. The deviation is volume weighted from the same
accumulator as the VWAP itself, not a simple standard deviation of price.
Show only the current period. Hides every completed day, week and month and
draws just the anchors that are still building. Useful when you only trade the
live level and want the history out of the way.
Auto-hide. A daily VWAP on a daily chart is just the bar itself, so anchors
that are meaningless on the current timeframe are hidden automatically. Can be
turned off.
Line breaks at each reset, so you do not get a vertical spike connecting the
end of one period to the start of the next.
Value labels at the right edge showing the live price of each VWAP.
Alerts for price crossing the daily, weekly or monthly VWAP.
Selectable source, defaulting to hlc3, which is the standard VWAP price.
NOTES
The indicator needs real volume. If the symbol's data feed provides none, it
will tell you instead of silently drawing a flat line. Some index and CFD style
tickers have no volume; use an exchange specific ticker in that case.
Values update on every tick. When a new period begins, the reset happens on the
first tick of that period's first bar. You do not have to wait for a bar to
close.
This is a reference and context tool, not a signal generator. VWAP tells you
where value is, not which way price is going next. Use it to frame entries,
size risk against a level, and judge whether a move is extended, and combine it
with your own method rather than trading crosses on their own.
Three independently anchored volume weighted average prices on one chart. Each
one resets on the first tick of a new day, week and month, so you always see
where the daily, weekly and monthly volume has actually been transacted rather
than a single rolling average.
WHAT IT DOES
VWAP is the average price of every trade in a period, weighted by size. It is
the reference price large orders are measured against, which is why price so
often gravitates back to it. A daily VWAP tells you who is winning the session,
a weekly VWAP frames the swing, and a monthly VWAP marks the level that
positional money is anchored to. Having all three at once shows you when they
stack up (trend) and when they pinch together (compression before expansion).
Each VWAP is accumulated bar by bar from the raw price and volume of the chart
you are on. Nothing is smoothed, averaged again, or borrowed from a higher
timeframe request, so there is no repainting and no lag beyond the data itself.
ANCHORING
The whole point of a periodic VWAP is where it resets, so the anchor is
configurable rather than assumed.
Session (exchange) resets when TradingView opens a new daily, weekly or monthly
bar. This respects the symbol's real session, so a futures day correctly begins
at 18:00 the previous evening and a stock day begins at the opening bell. This
matches the behaviour of the built-in VWAP.
Calendar resets at 00:00 in a timezone you choose: the exchange timezone, UTC,
or any IANA timezone you type in. This is normally what you want on 24/7 crypto,
where there is no session and the market convention is a UTC day.
Pick the mode that matches how you actually think about the instrument. For
crypto, Calendar UTC. For futures, FX and equities, Session.
FEATURES
Daily, weekly and monthly VWAP, each with its own colour, line width and
on/off switch.
Optional standard deviation bands on any of the three, with a configurable
multiplier and a shaded fill. The deviation is volume weighted from the same
accumulator as the VWAP itself, not a simple standard deviation of price.
Show only the current period. Hides every completed day, week and month and
draws just the anchors that are still building. Useful when you only trade the
live level and want the history out of the way.
Auto-hide. A daily VWAP on a daily chart is just the bar itself, so anchors
that are meaningless on the current timeframe are hidden automatically. Can be
turned off.
Line breaks at each reset, so you do not get a vertical spike connecting the
end of one period to the start of the next.
Value labels at the right edge showing the live price of each VWAP.
Alerts for price crossing the daily, weekly or monthly VWAP.
Selectable source, defaulting to hlc3, which is the standard VWAP price.
NOTES
The indicator needs real volume. If the symbol's data feed provides none, it
will tell you instead of silently drawing a flat line. Some index and CFD style
tickers have no volume; use an exchange specific ticker in that case.
Values update on every tick. When a new period begins, the reset happens on the
first tick of that period's first bar. You do not have to wait for a bar to
close.
This is a reference and context tool, not a signal generator. VWAP tells you
where value is, not which way price is going next. Use it to frame entries,
size risk against a level, and judge whether a move is extended, and combine it
with your own method rather than trading crosses on their own.

免責聲明
這些資訊和出版物並非旨在提供,也不構成TradingView提供或認可的任何形式的財務、投資、交易或其他類型的建議或推薦。請閱讀使用條款以了解更多資訊。
免責聲明
這些資訊和出版物並非旨在提供,也不構成TradingView提供或認可的任何形式的財務、投資、交易或其他類型的建議或推薦。請閱讀使用條款以了解更多資訊。