OPEN-SOURCE SCRIPT
已更新 Straddle Tracker + Market Dashboard
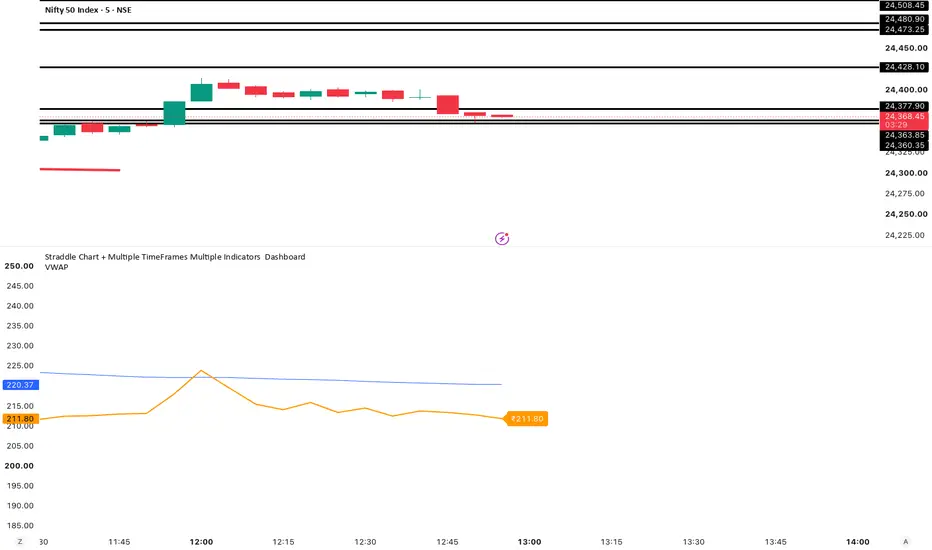
RM Straddle Tracker + Multi-Timeframe Market Dashboard
The RM Straddle Tracker + Market Dashboard is a professional options analysis tool designed for traders who monitor ATM Straddles, Futures Pairs, Synthetic Positions, and Premium-Based Market Direction.
Instead of analyzing only price action, this indicator tracks the combined premium value of two instruments (typically Call + Put) and evaluates market sentiment across multiple timeframes using a powerful dashboard of trend and momentum indicators.
Key Features
✅ Real-Time Straddle Premium Tracking
Tracks combined premium of:
Call + Put Options
Futures Pairs
Any two custom symbols
Displays live combined premium line.
Shows current straddle value directly on the chart.
✅ Multi-Timeframe Market Dashboard
Analyze sentiment across:
5 Minute
15 Minute
1 Hour
1 Day
1 Week
1 Month
Get a quick overview of market strength without switching charts.
Indicators Included
Moving Averages
SMA 9
SMA 20
SMA 50
SMA 100
SMA 200
Momentum
RSI (14)
MACD Histogram
Trend
Custom Non-Repainting SuperTrend
Each indicator is classified as:
🟢 Bullish
🔴 Bearish
⚪ Neutral
Unique Shift Price Technology
One of the most powerful features of this dashboard is the Shift Price Tracker.
Whenever an indicator changes from:
Bullish → Bearish
Bearish → Bullish
the dashboard captures and stores the exact straddle premium at the moment of the shift.
This allows traders to:
Identify important sentiment changes.
Compare current premium with previous trend reversals.
Track premium expansion and contraction.
Build better entry and exit decisions.
Smart Alert System
Receive alerts whenever:
SMA trend changes
RSI flips direction
MACD changes bias
SuperTrend reverses
Alerts are generated only on confirmed state changes to reduce noise.
Best Use Cases
✔ NIFTY Weekly Straddles
✔ BANKNIFTY Weekly Straddles
✔ FINNIFTY Straddles
✔ Synthetic Futures Tracking
✔ Options Selling Strategies
✔ Volatility Monitoring
✔ Premium Expansion Analysis
✔ Multi-Timeframe Trend Confirmation
Advantages
Multi-timeframe analysis in one screen
Premium-based market sentiment
Non-repainting dashboard logic
Shift-price memory system
Customizable timeframes and indicators
Suitable for intraday and positional traders
Disclaimer
This indicator is an analytical and educational tool. It does not provide financial advice. Always use proper risk management and perform your own analysis before taking any trade decisions.
The RM Straddle Tracker + Market Dashboard is a professional options analysis tool designed for traders who monitor ATM Straddles, Futures Pairs, Synthetic Positions, and Premium-Based Market Direction.
Instead of analyzing only price action, this indicator tracks the combined premium value of two instruments (typically Call + Put) and evaluates market sentiment across multiple timeframes using a powerful dashboard of trend and momentum indicators.
Key Features
✅ Real-Time Straddle Premium Tracking
Tracks combined premium of:
Call + Put Options
Futures Pairs
Any two custom symbols
Displays live combined premium line.
Shows current straddle value directly on the chart.
✅ Multi-Timeframe Market Dashboard
Analyze sentiment across:
5 Minute
15 Minute
1 Hour
1 Day
1 Week
1 Month
Get a quick overview of market strength without switching charts.
Indicators Included
Moving Averages
SMA 9
SMA 20
SMA 50
SMA 100
SMA 200
Momentum
RSI (14)
MACD Histogram
Trend
Custom Non-Repainting SuperTrend
Each indicator is classified as:
🟢 Bullish
🔴 Bearish
⚪ Neutral
Unique Shift Price Technology
One of the most powerful features of this dashboard is the Shift Price Tracker.
Whenever an indicator changes from:
Bullish → Bearish
Bearish → Bullish
the dashboard captures and stores the exact straddle premium at the moment of the shift.
This allows traders to:
Identify important sentiment changes.
Compare current premium with previous trend reversals.
Track premium expansion and contraction.
Build better entry and exit decisions.
Smart Alert System
Receive alerts whenever:
SMA trend changes
RSI flips direction
MACD changes bias
SuperTrend reverses
Alerts are generated only on confirmed state changes to reduce noise.
Best Use Cases
✔ NIFTY Weekly Straddles
✔ BANKNIFTY Weekly Straddles
✔ FINNIFTY Straddles
✔ Synthetic Futures Tracking
✔ Options Selling Strategies
✔ Volatility Monitoring
✔ Premium Expansion Analysis
✔ Multi-Timeframe Trend Confirmation
Advantages
Multi-timeframe analysis in one screen
Premium-based market sentiment
Non-repainting dashboard logic
Shift-price memory system
Customizable timeframes and indicators
Suitable for intraday and positional traders
Disclaimer
This indicator is an analytical and educational tool. It does not provide financial advice. Always use proper risk management and perform your own analysis before taking any trade decisions.
發行說明
The Script Name is changed as it describes much more than the old version發行說明
Removed the prices in the dashboard to avoid some noise 發行說明
changed some styles發行說明
REMOVED MULTIPLE LABELS ON THE STRADDLE CHART LINE, PRICE AT THE END OF THE LINE.開源腳本
秉持TradingView一貫精神,這個腳本的創作者將其設為開源,以便交易者檢視並驗證其功能。向作者致敬!您可以免費使用此腳本,但請注意,重新發佈代碼需遵守我們的社群規範。

I have been trading since 2019 , had gone through all greeds, fears, panics, profits and losses. been searching for a best ever setup each day, one after other, in the way i started developing indicators.Finally you can see all my stuff here.HappyTrading
免責聲明
這些資訊和出版物並非旨在提供,也不構成TradingView提供或認可的任何形式的財務、投資、交易或其他類型的建議或推薦。請閱讀使用條款以了解更多資訊。
開源腳本
秉持TradingView一貫精神,這個腳本的創作者將其設為開源,以便交易者檢視並驗證其功能。向作者致敬!您可以免費使用此腳本,但請注意,重新發佈代碼需遵守我們的社群規範。
I have been trading since 2019 , had gone through all greeds, fears, panics, profits and losses. been searching for a best ever setup each day, one after other, in the way i started developing indicators.Finally you can see all my stuff here.HappyTrading
免責聲明
這些資訊和出版物並非旨在提供,也不構成TradingView提供或認可的任何形式的財務、投資、交易或其他類型的建議或推薦。請閱讀使用條款以了解更多資訊。