OPEN-SOURCE SCRIPT
已更新 Bitcoin CME GAP [SAKANE]
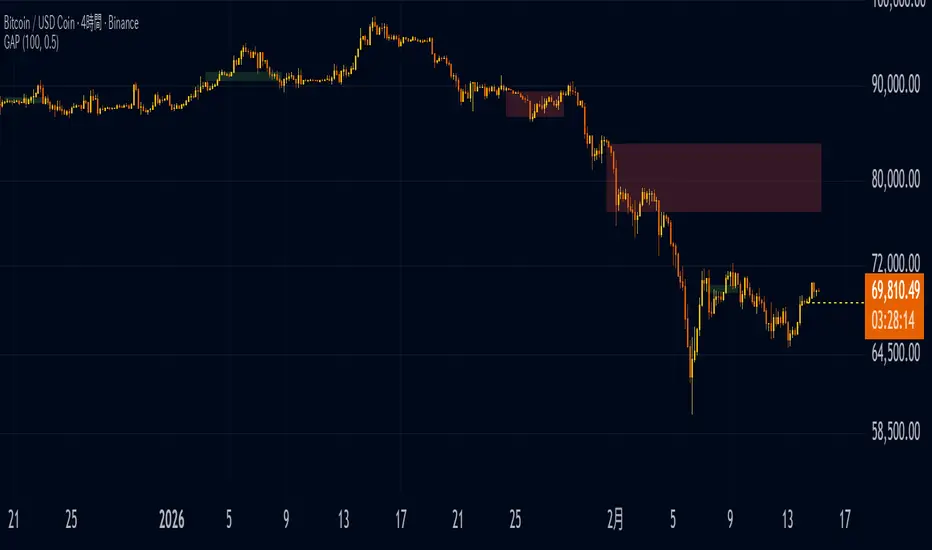
This indicator detects and visualizes the weekend gap in CME Bitcoin futures (BTC1!), defined as the difference between the Friday settlement price and the Monday opening price. It stores the final CME close, waits for trading to resume, and then measures the gap. If the gap exceeds the user-defined threshold, it is displayed as a box on the chart. The box remains active until price returns to the gap’s closing level or a specified number of bars has elapsed. During the CME weekend closure, a horizontal reference line marks where CME last settled, providing a clear anchor for price positioning.
A key feature is that the gap is displayed correctly even on spot or perpetual BTC charts. Because futures prices often trade at a premium or discount relative to spot markets, plotting CME levels directly would misplace the gap. This script calculates the price difference between CME and the chart instrument and shifts the gap vertically into the chart’s price space while preserving its true size. As a result, traders can see the actual gap location where market participants are likely to react, without distortion from futures basis differences.
Gap-fill detection is performed using CME futures prices themselves. The script evaluates whether the CME high or low has reached the prior CME close level that defines the gap. This ensures that once the gap is filled in the futures market, it is considered filled everywhere. Because of this CME-based validation combined with spot-space visualization, users can determine whether a gap has closed without switching to the BTC1! chart.
CME gaps are widely observed by market participants because price frequently revisits and fills these discontinuities. By highlighting both the location and the fill status of the gap, this indicator helps track the gap-closure tendency and provides insight into short-term liquidity imbalances, derivatives-driven dislocations, and the market’s process of price repair.
A key feature is that the gap is displayed correctly even on spot or perpetual BTC charts. Because futures prices often trade at a premium or discount relative to spot markets, plotting CME levels directly would misplace the gap. This script calculates the price difference between CME and the chart instrument and shifts the gap vertically into the chart’s price space while preserving its true size. As a result, traders can see the actual gap location where market participants are likely to react, without distortion from futures basis differences.
Gap-fill detection is performed using CME futures prices themselves. The script evaluates whether the CME high or low has reached the prior CME close level that defines the gap. This ensures that once the gap is filled in the futures market, it is considered filled everywhere. Because of this CME-based validation combined with spot-space visualization, users can determine whether a gap has closed without switching to the BTC1! chart.
CME gaps are widely observed by market participants because price frequently revisits and fills these discontinuities. By highlighting both the location and the fill status of the gap, this indicator helps track the gap-closure tendency and provides insight into short-term liquidity imbalances, derivatives-driven dislocations, and the market’s process of price repair.
發行說明
The adjustPremium option has been added to control how the gap is positioned on the chart.When adjustPremium is OFF, the gap is drawn using raw CME futures prices. The box is plotted directly between the BTC1! Friday close (g_prev) and Monday open (g_open). Because no adjustment is applied, the gap reflects CME’s absolute price levels, including any futures premium or discount relative to spot markets.
When adjustPremium is ON, the gap is aligned to the chart’s price space. The Friday side is anchored to the chart’s closing price at the same moment as the CME Friday close (last_chart_close), while the Monday side uses the chart’s opening price on the CME reopen bar (open). In practice, this aligns the gap with the price levels of the instrument being viewed (e.g., Binance spot or perpetual), making it easier to see where the gap-equivalent discontinuity exists in the spot market.
Importantly, gap-fill detection continues to be evaluated strictly using CME futures prices (cme_high_off / cme_low_off). Even when the gap is visually aligned to the chart’s price space, fill status remains CME-native and consistent. This allows users to determine whether the CME gap has been filled without switching to the BTC1! chart.
發行說明
Fixed an issue where the indicator would fail to display on certain symbols and timeframes.發行說明
- Fixed: CME close ray no longer appears vertical on higher timeframes (4H, etc.)→ Switched from xloc.bar_time to xloc.bar_index for ray drawing
- Fixed: CME close ray price now consistent across all timeframes (1H, 4H, etc.)
→ Chart close price is now always fetched from 1H candles, preventing discrepancies caused by CME closing mid-candle on higher timeframes
發行說明
Bug fixes開源腳本
秉持TradingView一貫精神,這個腳本的創作者將其設為開源,以便交易者檢視並驗證其功能。向作者致敬!您可以免費使用此腳本,但請注意,重新發佈代碼需遵守我們的社群規範。

免責聲明
這些資訊和出版物並非旨在提供,也不構成TradingView提供或認可的任何形式的財務、投資、交易或其他類型的建議或推薦。請閱讀使用條款以了解更多資訊。
開源腳本
秉持TradingView一貫精神,這個腳本的創作者將其設為開源,以便交易者檢視並驗證其功能。向作者致敬!您可以免費使用此腳本,但請注意,重新發佈代碼需遵守我們的社群規範。
免責聲明
這些資訊和出版物並非旨在提供,也不構成TradingView提供或認可的任何形式的財務、投資、交易或其他類型的建議或推薦。請閱讀使用條款以了解更多資訊。