OPEN-SOURCE SCRIPT
Volatility of Volatility [ThetaLoop]
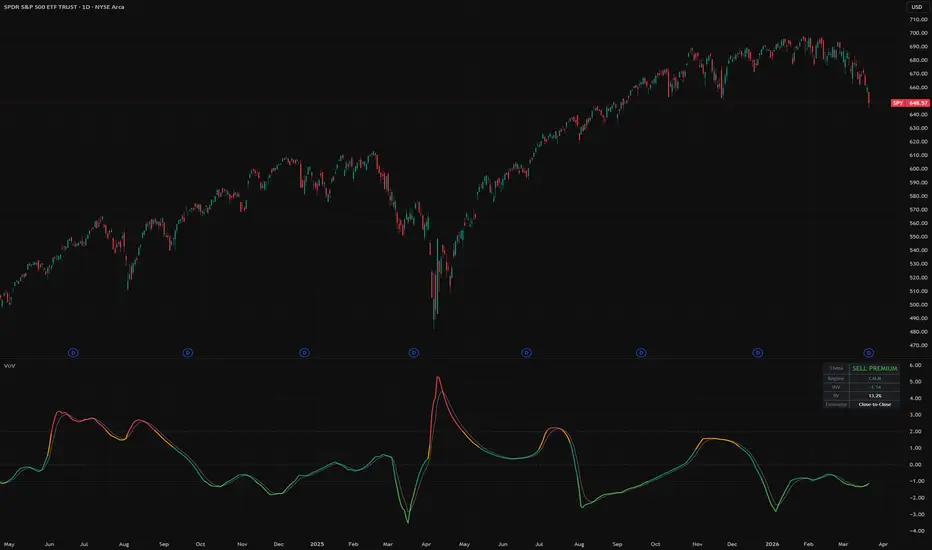
Here is a thought experiment.
Two stocks both have 25% annualized volatility right now. Stock A has been sitting between 23% and 27% for six months. Stock B was at 12% three weeks ago, spiked to 40%, and just happened to pass through 25% on its way back down.
Would you sell the same put on both? Probably not. But every standard volatility indicator shows the exact same number for both.
This indicator solves that problem. It measures how stable volatility itself is — the second derivative of risk. The CBOE publishes this concept as the VVIX index, but only for the S&P 500. This version works on any stock, ETF, commodity, or crypto pair because it derives everything from price data alone.
The math is straightforward: take rolling realized volatility, then measure the standard deviation of that volatility over a longer window. Normalize as a Z-Score and you get a clean oscillator that answers one question — can I trust my current volatility estimate?
Reading the indicator
CALM regime — Volatility has been stable and predictable. Your realized vol estimate is reliable. This is the ideal environment for selling premium because theta decay behaves as expected and position sizing math works as intended.
NORMAL regime — Some fluctuation in vol, nothing unusual. Standard conditions.
ELEVATED regime — Volatility is jumping around. Your vol estimate might be stale by tomorrow. Consider reducing position size because your risk calculations are built on an unstable foundation.
UNSTABLE regime — Vol is all over the place. Whatever number your broker shows you for IV or HV is probably wrong by the time you submit your order. The premium looks juicy but you cannot reliably estimate what you are actually risking.
Estimator choice
Close-to-Close uses standard log return standard deviation. Simple, widely understood, matches what most platforms report as "historical volatility."
Parkinson uses the daily High-Low range instead. It extracts roughly 5x more information from each bar because it captures intraday movement, not just where the price happened to land at the close. Generally recommended unless you are analyzing something with unreliable intraday data.
Settings overview
RV Window (default 20) — How many days of returns to use for the inner realized volatility calculation. Shorter = more reactive but noisier.
VoV Window (default 60) — How many days of vol readings to analyze for stability. Longer = more reliable regime classification but slower to react.
Display Mode — Z-Score (default, deviation from normal), Percentile (0-100 rank), or Raw (unnormalized coefficient of variation).
Alerts
VoV Unstable — Volatility stability has deteriorated to extreme levels.
VoV Calm — Volatility has become unusually stable. Favorable conditions for systematic premium selling.
開源腳本
秉持TradingView一貫精神,這個腳本的創作者將其設為開源,以便交易者檢視並驗證其功能。向作者致敬!您可以免費使用此腳本,但請注意,重新發佈代碼需遵守我們的社群規範。

ThetaLoop | Algorithmic Options Research
🔍 Free CSP Score for any ticker — X-Ray Scanner:
thetaloop.app/xray
(Not financial advice)
🔍 Free CSP Score for any ticker — X-Ray Scanner:
thetaloop.app/xray
(Not financial advice)
免責聲明
這些資訊和出版物並非旨在提供,也不構成TradingView提供或認可的任何形式的財務、投資、交易或其他類型的建議或推薦。請閱讀使用條款以了解更多資訊。
開源腳本
秉持TradingView一貫精神,這個腳本的創作者將其設為開源,以便交易者檢視並驗證其功能。向作者致敬!您可以免費使用此腳本,但請注意,重新發佈代碼需遵守我們的社群規範。
ThetaLoop | Algorithmic Options Research
🔍 Free CSP Score for any ticker — X-Ray Scanner:
thetaloop.app/xray
(Not financial advice)
🔍 Free CSP Score for any ticker — X-Ray Scanner:
thetaloop.app/xray
(Not financial advice)
免責聲明
這些資訊和出版物並非旨在提供,也不構成TradingView提供或認可的任何形式的財務、投資、交易或其他類型的建議或推薦。請閱讀使用條款以了解更多資訊。