OPEN-SOURCE SCRIPT
已更新 Close Momentum (Area)
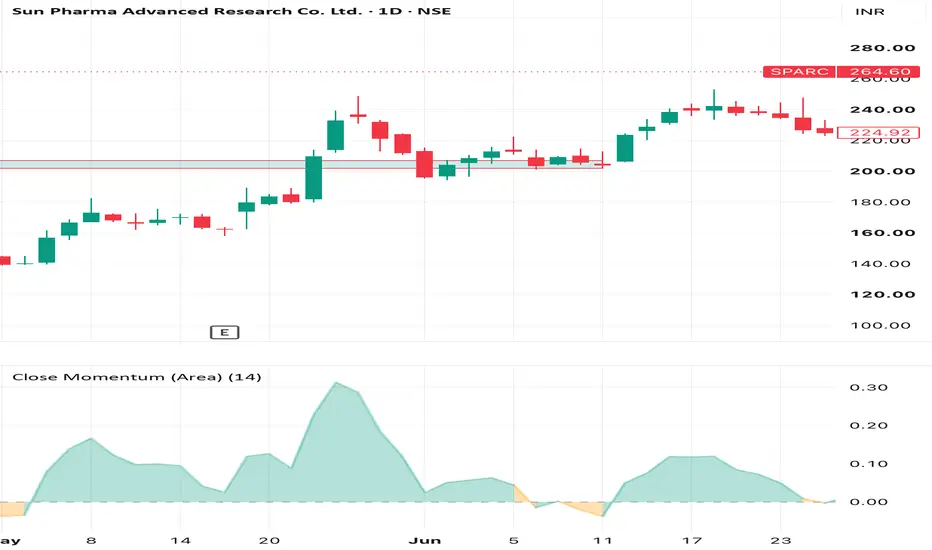
This indicator measures how today’s closing price compares to its own average over a user-defined lookback period (default: ~6 months). It helps you quickly see whether price is trading above or below its medium-term average in a single, easy-to-read pane.
Formula:
Momentum = Close ÷ Average Close (over N days)
• Momentum > 1 → Price is above its N-day average (bullish relative to medium-term mean).
• Momentum = 1 → Price equals its N-day average.
• Momentum < 1 → Price is below its N-day average (bearish relative to medium-term mean).
The result is plotted as a filled area anchored at the 1.0 line, making it easy tospot regimes where price is persistently strong (>1) or weak (<1).
Settings:
• Lookback days for average close – Number of bars used to calculate the average close.
• Default: 126 (≈ 6 months, assuming ~21 trading days/month).
• Adjust for shorter/longer horizons (e.g., 63 for ~3 months, 252 for ~1 year).
How traders can use it:
• Identify trend bias: sustained readings above 1 suggest an uptrend relative to the chosen period; below 1 suggests a downtrend.
• Spot mean-reversion setups: extremes far from 1 may indicate overextended moves.
• Combine with price action or other indicators to filter entries and confirm momentum shifts.
This is a simple, visual way to track medium-term price momentum without cluttering your main chart.
Formula:
Momentum = Close ÷ Average Close (over N days)
• Momentum > 1 → Price is above its N-day average (bullish relative to medium-term mean).
• Momentum = 1 → Price equals its N-day average.
• Momentum < 1 → Price is below its N-day average (bearish relative to medium-term mean).
The result is plotted as a filled area anchored at the 1.0 line, making it easy tospot regimes where price is persistently strong (>1) or weak (<1).
Settings:
• Lookback days for average close – Number of bars used to calculate the average close.
• Default: 126 (≈ 6 months, assuming ~21 trading days/month).
• Adjust for shorter/longer horizons (e.g., 63 for ~3 months, 252 for ~1 year).
How traders can use it:
• Identify trend bias: sustained readings above 1 suggest an uptrend relative to the chosen period; below 1 suggests a downtrend.
• Spot mean-reversion setups: extremes far from 1 may indicate overextended moves.
• Combine with price action or other indicators to filter entries and confirm momentum shifts.
This is a simple, visual way to track medium-term price momentum without cluttering your main chart.
發行說明
• momentum itself is centered around 1.0, so plotting it with area style makes TradingView fill the space between 1 and the value.• By plotting delta = momentum - 1.0 , the baseline becomes 0, so the filled area is centered properly and no longer occupies the full band from 1 to 0.
發行說明
changed the name開源腳本
秉持TradingView一貫精神,這個腳本的創作者將其設為開源,以便交易者檢視並驗證其功能。向作者致敬!您可以免費使用此腳本,但請注意,重新發佈代碼需遵守我們的社群規範。

免責聲明
這些資訊和出版物並非旨在提供,也不構成TradingView提供或認可的任何形式的財務、投資、交易或其他類型的建議或推薦。請閱讀使用條款以了解更多資訊。
免責聲明
這些資訊和出版物並非旨在提供,也不構成TradingView提供或認可的任何形式的財務、投資、交易或其他類型的建議或推薦。請閱讀使用條款以了解更多資訊。