CISD MTF (5m + 15m)
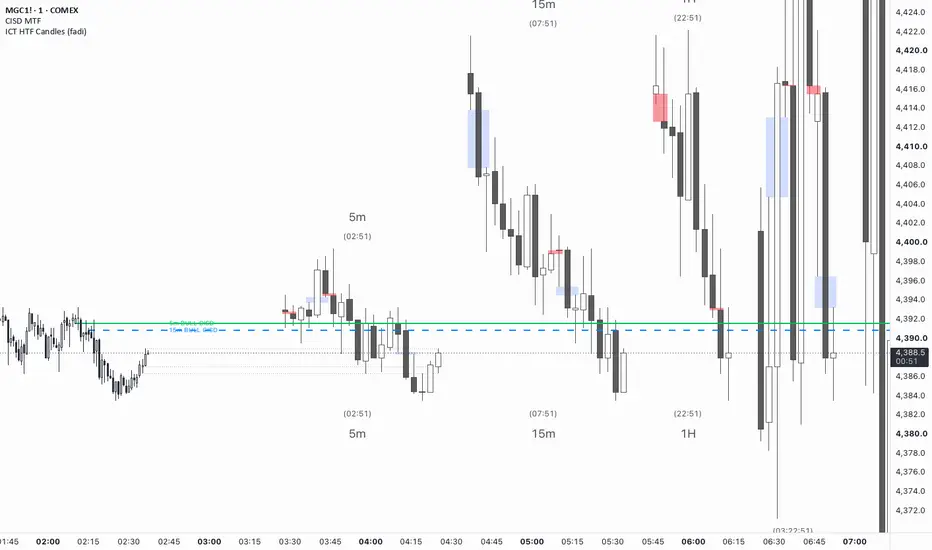
CISD MTF is a multi-timeframe Change in State of Delivery (CISD) indicator designed to display the active 5-minute and 15-minute CISD reference levels directly on a lower-timeframe chart.
The indicator focuses on a simple question:
What level does price need to close through before the current delivery state can be considered changed?
Unlike a simple candle-color or crossover signal, the indicator maintains the current delivery state until the relevant CISD level is actually confirmed. An opposite-colored candle, wick through the level, or temporary swing by itself does not automatically change the displayed direction.
Key features:
- Displays 5m and 15m CISD levels on lower-timeframe charts
- Tracks only the currently relevant CISD direction for each timeframe
- Uses confirmed higher-timeframe candle closes, not intrabar price
- A wick through a CISD level does not confirm a state change
- Bull CISD remains active during bearish delivery until price confirms above it
- Bear CISD remains active during bullish delivery until price confirms below it
- Automatically replaces the previous CISD reference when the delivery state changes
- Right-edge labels make the active levels easy to identify
- Includes alerts when active CISD references change
How I use it
I use CISD as confirmation/context rather than a standalone entry signal.
For example, during bearish delivery, the Bull CISD shows the level price would need to reclaim on a confirmed close before I consider evidence of a bullish character change. Likewise, during bullish delivery, the Bear CISD marks the level price would need to close below before bearish delivery is confirmed.
I typically combine CISD with market structure, EMA structure, liquidity, displacement, and pullback locations rather than entering immediately when a CISD occurs.
Important: This indicator is intended as a market-structure visualization and research tool. It does not provide financial advice or guarantee that a trend reversal or continuation will occur.
The indicator focuses on a simple question:
What level does price need to close through before the current delivery state can be considered changed?
- A Bull CISD is the reference level price must close above to confirm a bullish change in delivery.
- A Bear CISD is the reference level price must close below to confirm a bearish change in delivery.
Unlike a simple candle-color or crossover signal, the indicator maintains the current delivery state until the relevant CISD level is actually confirmed. An opposite-colored candle, wick through the level, or temporary swing by itself does not automatically change the displayed direction.
Key features:
- Displays 5m and 15m CISD levels on lower-timeframe charts
- Tracks only the currently relevant CISD direction for each timeframe
- Uses confirmed higher-timeframe candle closes, not intrabar price
- A wick through a CISD level does not confirm a state change
- Bull CISD remains active during bearish delivery until price confirms above it
- Bear CISD remains active during bullish delivery until price confirms below it
- Automatically replaces the previous CISD reference when the delivery state changes
- Right-edge labels make the active levels easy to identify
- Includes alerts when active CISD references change
How I use it
I use CISD as confirmation/context rather than a standalone entry signal.
For example, during bearish delivery, the Bull CISD shows the level price would need to reclaim on a confirmed close before I consider evidence of a bullish character change. Likewise, during bullish delivery, the Bear CISD marks the level price would need to close below before bearish delivery is confirmed.
I typically combine CISD with market structure, EMA structure, liquidity, displacement, and pullback locations rather than entering immediately when a CISD occurs.
Important: This indicator is intended as a market-structure visualization and research tool. It does not provide financial advice or guarantee that a trend reversal or continuation will occur.

免責聲明
這些資訊和出版物並非旨在提供,也不構成TradingView提供或認可的任何形式的財務、投資、交易或其他類型的建議或推薦。請閱讀使用條款以了解更多資訊。