已更新
Fibonacci Multi-Symbol Watchlist
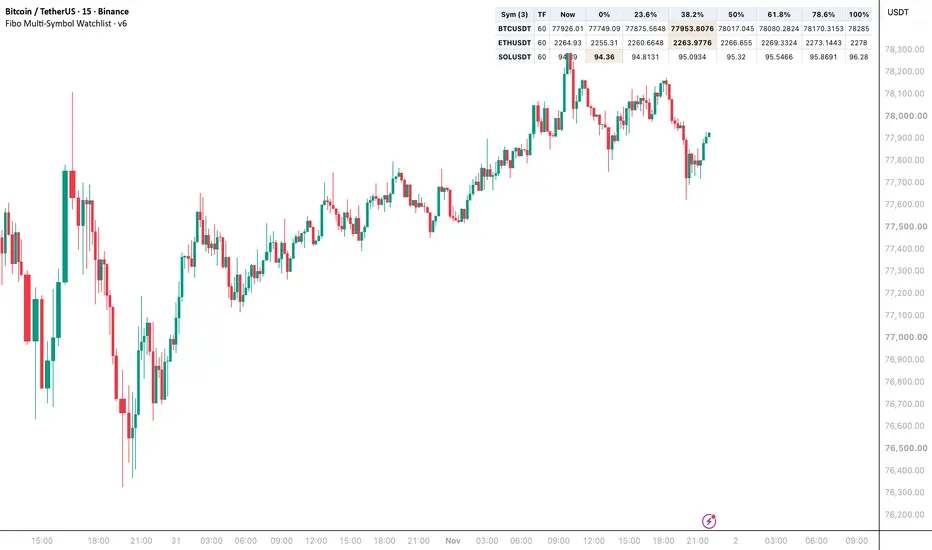
Fibo Multi-Symbol Watchlist evaluates up to ten user-selected symbols and shows, in a single panel on the chart, the price at each standard Fibonacci retracement level for every symbol on its own configurable timeframe.
For every symbol the script detects the most recent swing high and swing low on the chosen timeframe using pivot detection with a configurable swing length and lookback window. The seven standard retracement levels (zero percent, twenty-three point six, thirty-eight point two, fifty, sixty-one point eight, seventy-eight point six, and one hundred percent) are computed between the swing low (zero percent) and the swing high (one hundred percent). The current price is also shown as a reference column.
The level closest to the current price is automatically highlighted. When the distance between the price and that level is within the configured proximity threshold, its cell turns yellow and is bolded so the nearest level stands out at a glance. If no recent swing has been detected within the lookback window, the cells show a dash and no level is highlighted.
Settings include ten symbol and timeframe pairs (leave any symbol empty to skip it), pivot swing length, pivot lookback in bars, the proximity percentage for highlighting the nearest level, and the panel position. Each symbol has its own timeframe input, so the same panel can show a one-hour fibo for Bitcoin, a four-hour fibo for Ethereum, and a daily fibo for any other symbol at the same time.
Limitations. The script uses one request.security() call per symbol, so it is capped at ten symbols by Pine's call budget. The fibo is always drawn from the swing low to the swing high; for downtrends the user can interpret the levels inversely. Only the seven standard retracement levels are included; extension levels (one hundred twenty-seven point two percent, one hundred sixty-one point eight percent, and so on) are not shown.
Recommended use. Set the timeframe per symbol to match the analysis horizon you trade. For intraday scalping, one hour to four hours usually works well. For swing trading, daily to weekly. Adjust the swing length to ignore noise on the selected timeframe and the proximity threshold to match the volatility of the instruments.
For every symbol the script detects the most recent swing high and swing low on the chosen timeframe using pivot detection with a configurable swing length and lookback window. The seven standard retracement levels (zero percent, twenty-three point six, thirty-eight point two, fifty, sixty-one point eight, seventy-eight point six, and one hundred percent) are computed between the swing low (zero percent) and the swing high (one hundred percent). The current price is also shown as a reference column.
The level closest to the current price is automatically highlighted. When the distance between the price and that level is within the configured proximity threshold, its cell turns yellow and is bolded so the nearest level stands out at a glance. If no recent swing has been detected within the lookback window, the cells show a dash and no level is highlighted.
Settings include ten symbol and timeframe pairs (leave any symbol empty to skip it), pivot swing length, pivot lookback in bars, the proximity percentage for highlighting the nearest level, and the panel position. Each symbol has its own timeframe input, so the same panel can show a one-hour fibo for Bitcoin, a four-hour fibo for Ethereum, and a daily fibo for any other symbol at the same time.
Limitations. The script uses one request.security() call per symbol, so it is capped at ten symbols by Pine's call budget. The fibo is always drawn from the swing low to the swing high; for downtrends the user can interpret the levels inversely. Only the seven standard retracement levels are included; extension levels (one hundred twenty-seven point two percent, one hundred sixty-one point eight percent, and so on) are not shown.
Recommended use. Set the timeframe per symbol to match the analysis horizon you trade. For intraday scalping, one hour to four hours usually works well. For swing trading, daily to weekly. Adjust the swing length to ignore noise on the selected timeframe and the proximity threshold to match the volatility of the instruments.
發行說明
FIBONACCI MULTI-SYMBOL WATCHLIST — COMPARE REFERENCE LEVELS IN ONE PANELFibonacci Watchlist displays seven pivot-derived reference prices for up to ten symbols. Each row has its own source timeframe, so the panel can compare different markets and intervals without replacing the chart symbol.
The amber highlight identifies the nearest level only when its percentage distance meets your threshold. It expresses proximity, not a directional signal or a tested probability of reversal.
01 / CHOOSE THE MARKETS AND INTERVALS
The first three slots initially contain BINANCE:BTCUSDT, BINANCE:ETHUSDT and BINANCE:SOLUSDT, each on 60 minutes. The other seven are blank and omitted from the visible panel. Use valid TradingView symbols with the intended exchange/feed; prices from different venues need not match.
Each TF input applies to that row's pivots and price. Changing the chart interval does not replace an explicitly selected row interval. The TF column displays the stored timeframe notation, such as 60 for one hour. Symbol names omit their exchange prefix for compactness, so check the inputs when comparing similarly named feeds.
02 / HOW THE ANCHORS ARE SELECTED
The engine independently stores the latest confirmed pivot high and latest confirmed pivot low on each row's source timeframe. Pivot swing length defaults to five bars on each side. Confirmation therefore occurs five source bars after the pivot, rather than on the candle where the extreme formed.
Pivot lookback bars, initially 50, measures the age of each anchor from its originating source bar. An anchor is cleared once its age is strictly greater than that limit. If either anchor is unavailable, the ladder values display dashes while the source close can remain available. Allow sufficient history for both the pivot confirmation and the range you are inspecting.
These are independent latest pivots. The script does not search for a manually chosen impulse leg, require a particular high/low time order or reverse the labels according to trend. In unusual sequences the stored high can be below the stored low; the interpolation then produces a descending ladder. Inspect the source chart before interpreting the numbers as a conventional retracement.
03 / SEVEN PRICES, ONE FORMULA
0% is the stored low anchor and 100% is the stored high anchor. Intermediate prices use:
level price = low anchor + (high anchor − low anchor) × ratio
The displayed ratios are 0%, 23.6%, 38.2%, 50%, 61.8%, 78.6% and 100%. The midpoint is included as a common reference. No extension levels, volume weighting or multi-pivot confluence score are calculated.
Now is the close from that row's requested symbol and interval, not the chart symbol's close copied into every row. Levels update when newly confirmed pivots replace an anchor, or disappear when an anchor expires.
04 / WHAT THE HIGHLIGHT MEANS
The panel calculates absolute distance from the requested close to every available level, divides by that close and expresses the result as a percentage. It selects the smallest distance and highlights that one cell when the distance is at or below the configured threshold, initially 0.5%.
Even if several levels are inside the threshold, only the nearest one is highlighted. An exact distance tie favors the first ratio encountered in the table's left-to-right order. A highlight does not require a touch, cross, rejection candle or later confirmation. The same threshold is shared by all rows; it is not normalized by each asset's ATR or volatility.
05 / A CLEARER PANEL
The refreshed panel follows the chart theme, with an opaque base that keeps underlying candles from interfering with its text. A soft blue header organizes the columns; amber isolates the nearby reference. Header and highlight accents are configurable.
Panel text size now defaults to Small, with Tiny and Normal available. Maximum price decimals offers two, four, six or eight decimal places, retaining four initially. This is display rounding, not a change to the level or distance calculations, and it does not automatically detect every symbol's tick size. Select more decimals when small prices would otherwise appear identical.
The panel initially sits at Top Right. The existing six positions remain available: Top Right, Top Left, Bottom Right, Bottom Left, Middle Right and Bottom Center. Show panel controls visibility. The script draws no Fibonacci lines on the chart and contains no dedicated alertcondition definitions.
06 / TIMING AND A REVIEW WORKFLOW
The existing data requests use gaps_off and lookahead_off. Now and the proximity highlight can change while a requested candle develops. Confirmed pivots have a known delay, but that does not make every displayed realtime value immutable. Historical and realtime availability can differ across intervals; a row is a current context readout rather than a synchronized record of tradable historical signals.
A row interval below the chart interval uses TradingView's sampled lower-timeframe request behavior; the panel does not aggregate or show every intrabar. Data updates also depend on the chart's executions, feed availability and market hours. A market being closed does not mean its last displayed reference has refreshed.
Start with a short watchlist, check each row's feed and timeframe, then inspect a highlighted market on its own chart. Verify its two anchors and the closing price before adding any separate entry, sizing or exit rules.
This update changes presentation only: theme-aware colors, readable text sizing and optional display precision. Symbol selection, pivot expiry, all ten requests, level formulas and nearest-level qualification remain unchanged.

免責聲明
這些資訊和出版物並非旨在提供,也不構成TradingView提供或認可的任何形式的財務、投資、交易或其他類型的建議或推薦。請閱讀使用條款以了解更多資訊。