VXTLT / MOVE Volatility Ratio
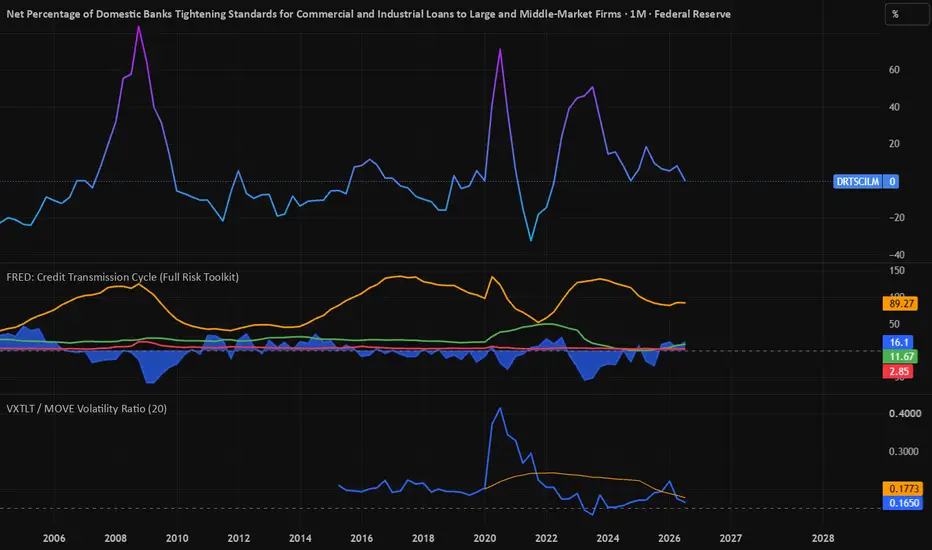
• The Baseline: Because VXTLT usually trades as a standard percentage (e.g., 16.5) and the MOVE index trades in normalized basis points (e.g., 106.0), the ratio values sit as decimal fractions.
• The Trend:
• When the blue line crosses above the orange moving average, long-end yield panic is growing faster than short-end Fed policy fears.
• When the blue line drops below the orange moving average, short-duration rate confusion is the dominant force in the macro environment.
VXTLT (Long-End Volatility) has expanded significantly, currently sitting elevated around 17.91.The MOVE Index (Broad Yield Volatility) is also elevated, closing yesterday at 110.45. StreetStats +1How to Understand the VXTLT / MOVE Ratio GraphIf you plug the script into TradingView right now, you are plotting a decimal fraction (approx. \(17.91 \div 110.45 \approx \mathbf{0.162}\)), which tracks whether the long end or short end is driving the panic. Here is how to interpret the line's position against your 20 SMA (Moving Average) and the 0.15 Baseline: 1. If the Ratio Line is Spiking Up (Above the 20 SMA) What it means: Long-end bond risk is outpacing short-end interest rate risk.Current Context: This accurately describes the current landscape. Investors are not just worried about the next Federal Reserve meeting; they are demanding a massive premium to hold long-term U.S. debt due to secular inflation fears and exploding fiscal deficits. Reuters +12. If the Ratio Line is Crashing Down (Below the 20 SMA) What it means: Near-term interest rate confusion is the dominant force.What triggers it: This happens when the market goes into a frenzy over short-term Fed policy changes or immediate economic data dumps, while long-term assumptions remain anchored. 3. Gauging the Baseline (0.15) Above 0.15: Long bonds (TLT) are experiencing highly concentrated, equity-style positioning and liquidity shocks relative to standard institutional OTC bond markets.Below 0.15: Institutional yield hedging across the broad curve is much higher than individual retail/ETF option panic.
• The Trend:
• When the blue line crosses above the orange moving average, long-end yield panic is growing faster than short-end Fed policy fears.
• When the blue line drops below the orange moving average, short-duration rate confusion is the dominant force in the macro environment.
VXTLT (Long-End Volatility) has expanded significantly, currently sitting elevated around 17.91.The MOVE Index (Broad Yield Volatility) is also elevated, closing yesterday at 110.45. StreetStats +1How to Understand the VXTLT / MOVE Ratio GraphIf you plug the script into TradingView right now, you are plotting a decimal fraction (approx. \(17.91 \div 110.45 \approx \mathbf{0.162}\)), which tracks whether the long end or short end is driving the panic. Here is how to interpret the line's position against your 20 SMA (Moving Average) and the 0.15 Baseline: 1. If the Ratio Line is Spiking Up (Above the 20 SMA) What it means: Long-end bond risk is outpacing short-end interest rate risk.Current Context: This accurately describes the current landscape. Investors are not just worried about the next Federal Reserve meeting; they are demanding a massive premium to hold long-term U.S. debt due to secular inflation fears and exploding fiscal deficits. Reuters +12. If the Ratio Line is Crashing Down (Below the 20 SMA) What it means: Near-term interest rate confusion is the dominant force.What triggers it: This happens when the market goes into a frenzy over short-term Fed policy changes or immediate economic data dumps, while long-term assumptions remain anchored. 3. Gauging the Baseline (0.15) Above 0.15: Long bonds (TLT) are experiencing highly concentrated, equity-style positioning and liquidity shocks relative to standard institutional OTC bond markets.Below 0.15: Institutional yield hedging across the broad curve is much higher than individual retail/ETF option panic.

免責聲明
這些資訊和出版物並非旨在提供,也不構成TradingView提供或認可的任何形式的財務、投資、交易或其他類型的建議或推薦。請閱讀使用條款以了解更多資訊。
免責聲明
這些資訊和出版物並非旨在提供,也不構成TradingView提供或認可的任何形式的財務、投資、交易或其他類型的建議或推薦。請閱讀使用條款以了解更多資訊。