OPEN-SOURCE SCRIPT
Deemer Breakaway Momentum Thrust
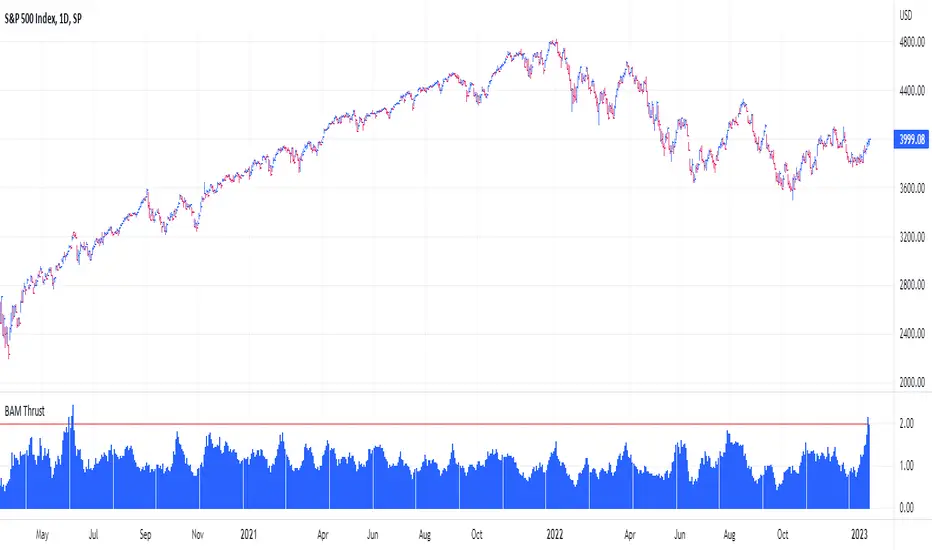
Breakaway momentum is a "breadth thrust" coined by Walter Deemer in the 1970s that occurs when the ten-day total advances on the NYSE are greater than 1.97 times the ten-day total NYSE declines.
This indicator calculates the ratio and plots it as a histogram. The 1.97 threshold is also plotted as a horizontal line. Anytime the histogram gets above the line Breakaway Momentum has occurred.
This is a rare signal that has only happened 25 times since 1945.
This indicator calculates the ratio and plots it as a histogram. The 1.97 threshold is also plotted as a horizontal line. Anytime the histogram gets above the line Breakaway Momentum has occurred.
This is a rare signal that has only happened 25 times since 1945.
開源腳本
秉持TradingView一貫精神,這個腳本的創作者將其設為開源,以便交易者檢視並驗證其功能。向作者致敬!您可以免費使用此腳本,但請注意,重新發佈代碼需遵守我們的社群規範。

Trusted Pine programmer. Send me a message for script development.
免責聲明
這些資訊和出版物並非旨在提供,也不構成TradingView提供或認可的任何形式的財務、投資、交易或其他類型的建議或推薦。請閱讀使用條款以了解更多資訊。
開源腳本
秉持TradingView一貫精神,這個腳本的創作者將其設為開源,以便交易者檢視並驗證其功能。向作者致敬!您可以免費使用此腳本,但請注意,重新發佈代碼需遵守我們的社群規範。
Trusted Pine programmer. Send me a message for script development.
免責聲明
這些資訊和出版物並非旨在提供,也不構成TradingView提供或認可的任何形式的財務、投資、交易或其他類型的建議或推薦。請閱讀使用條款以了解更多資訊。