已更新
Cumulative RVOL (Time-of-Day) + Breakout Confirmation
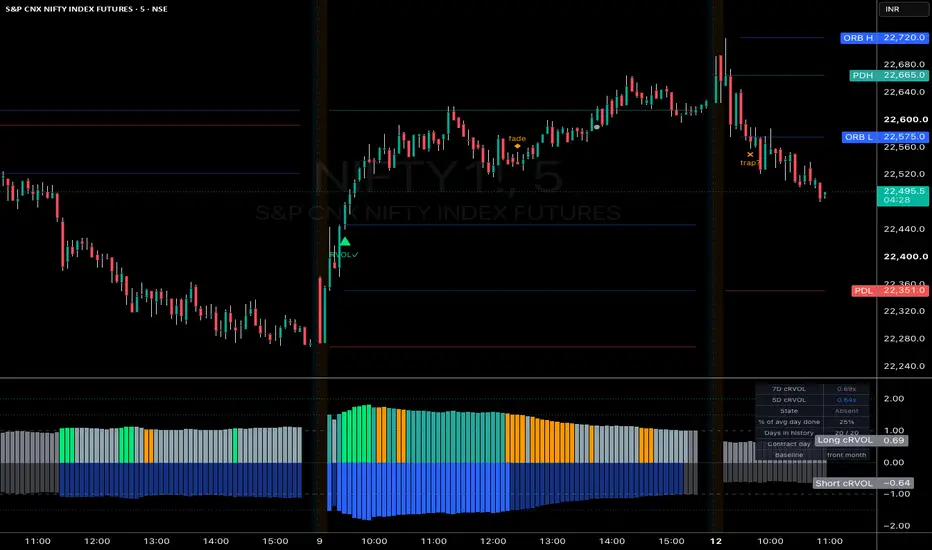
Is a breakout backed by real participation, or is it happening in an empty room? This script compares today's cumulative volume with what is normal for the same time of day, then grades every level break as confirmed, weak, or a trap risk.
WHAT IT MEASURES
Raw volume is misleading. 2M shares is huge for a stock that normally trades 200k, and nothing for one that trades 50M. Plain RVOL (today's volume ÷ average daily volume) is also misleading intraday, because volume is heavily front-loaded: at 10:00 every stock looks "low" against a full-day average.
This script uses cumulative time-of-day RVOL:
cRVOL = volume from the session open up to this bar ÷ average volume from the open up to the same time over the last N sessions
1.0 means "normal for this time of day". 2.0 means twice the usual participation at this point of the session. Two lookbacks are computed side by side:
HOW IT IS BUILT
READING THE PANE
Long-lookback columns are drawn above zero and short-lookback columns below zero (mirror layout, can be switched off). The minus sign below zero is only the drawing; read −1.8 as 1.8x. The long columns are coloured by participation state:
Reference lines sit at 1.0 (normal), 1.5 (in play) and 2.0 (hot).
BREAKOUT GRADING ON THE PRICE CHART
The script draws previous-day high/low, opening-range high/low (default 15 minutes) and an optional manual level. When the close crosses one of them, the break is graded by participation at that moment:
Each level fires at most once per direction per day, and new signals stop at a configurable cut-off time.
A small table shows the current long and short cRVOL, the state, how much of an average full day's volume has already traded, and how many sessions are in the history.
HOW IT DIFFERS FROM A STANDARD RVOL / RELATIVE-VOLUME-AT-TIME STUDY
HOW TO USE IT
SETTINGS
ALERTS
Confirmed breakout up, confirmed breakdown, trap risk, participation fading, and cRVOL crossing the hot threshold.
LIMITATIONS
CREDIT
The idea of judging breakouts by cumulative, time-of-day relative volume, and of reading participation as growing, holding, fading or absent, comes from a public educational video by SMB Capital on relative volume. This script is an independent Pine Script implementation of that concept.
This script is for educational and informational purposes only. It is not financial advice.
WHAT IT MEASURES
Raw volume is misleading. 2M shares is huge for a stock that normally trades 200k, and nothing for one that trades 50M. Plain RVOL (today's volume ÷ average daily volume) is also misleading intraday, because volume is heavily front-loaded: at 10:00 every stock looks "low" against a full-day average.
This script uses cumulative time-of-day RVOL:
cRVOL = volume from the session open up to this bar ÷ average volume from the open up to the same time over the last N sessions
1.0 means "normal for this time of day". 2.0 means twice the usual participation at this point of the session. Two lookbacks are computed side by side:
- Long (default 20 sessions): is this unusual versus the stock's monthly norm?
- Short (default 5 sessions): is it unusual even versus the recent days?
HOW IT IS BUILT
- Each completed session is stored as a cumulative-volume curve, one value per time slot (slot = minutes since the open ÷ chart timeframe). Slots are keyed by clock time rather than bar count, so thin symbols with missing bars stay aligned.
- Missing slots are forward-filled when a session closes. A partially loaded first session is discarded so it cannot drag the averages down.
- Nothing is plotted until the minimum history (default 5 sessions) has accumulated.
- On daily and higher timeframes it falls back to plain volume ÷ SMA of the previous N bars.
READING THE PANE
Long-lookback columns are drawn above zero and short-lookback columns below zero (mirror layout, can be switched off). The minus sign below zero is only the drawing; read −1.8 as 1.8x. The long columns are coloured by participation state:
- Grey, Absent: below 1.0, fewer participants than usual.
- Blue-grey, Normal: 1.0 up to the in-play threshold, flat.
- Bright green, Growing: rising over the last few bars.
- Teal, Holding: at or above the in-play threshold (default 1.5) and stable. This is the healthy case after a breakout.
- Orange, Fading: still elevated but falling.
Reference lines sit at 1.0 (normal), 1.5 (in play) and 2.0 (hot).
BREAKOUT GRADING ON THE PRICE CHART
The script draws previous-day high/low, opening-range high/low (default 15 minutes) and an optional manual level. When the close crosses one of them, the break is graded by participation at that moment:
- RVOL✓ (triangle): long cRVOL ≥ in-play threshold and short cRVOL ≥ 1.0. The break has real participation behind it.
- trap? (orange ×): both long and short cRVOL below 1.0. Price moved through the level, but participation did not show up.
- Grey dot: somewhere in between, a weak break.
- fade (orange diamond): after a confirmed break, long cRVOL drops back below the in-play threshold. Participation is leaving the move.
Each level fires at most once per direction per day, and new signals stop at a configurable cut-off time.
A small table shows the current long and short cRVOL, the state, how much of an average full day's volume has already traded, and how many sessions are in the history.
HOW IT DIFFERS FROM A STANDARD RVOL / RELATIVE-VOLUME-AT-TIME STUDY
- Two lookbacks shown together, so a stock that is hot versus last month but quiet versus last week is visible at a glance.
- Participation is classified into states (absent / normal / growing / holding / fading) instead of being shown as a bare number.
- Level breaks are graded by participation, which turns the ratio into a breakout-confirmation and trap-warning tool.
- A fade warning fires when a confirmed move loses its participation.
HOW TO USE IT
- Check the state first. Absent means levels matter less today, because fewer traders are watching them.
- When price reaches a level, look at the grade. RVOL✓ is a stronger case. trap? and the grey dot call for caution.
- After a break, watch the colour. Teal or green means participation is holding; orange followed by a fade marker means it is leaving.
- This is a filter and a confirmation tool, not an entry signal on its own. trap? means "unconfirmed", not "reverse": low-participation moves can and do continue.
SETTINGS
- Session open hour / minute and session length in exchange time. Defaults are NSE (09:15, 375 minutes); for US equities use 09:30 and 390.
- No new signals after N minutes from the open (default 365 = 15:20 IST).
- Long / short lookback, minimum history, in-play and hot thresholds, short-lookback confirmation level, slope bars and dead-band for the state.
- Toggle previous-day levels, opening range (and its length), manual level, level lines and the table.
ALERTS
Confirmed breakout up, confirmed breakdown, trap risk, participation fading, and cRVOL crossing the hot threshold.
LIMITATIONS
- It needs intraday history covering the lookback (20 sessions on a 1-minute chart is about 7,500 bars).
- It needs a symbol with volume. Spot indices have none; use futures or stocks.
- Continuous futures roll between contracts around expiry, which distorts volume comparisons for a few sessions.
- Half-day or special sessions enter the averages and can skew them for the following N sessions.
- On the real-time bar, the partial bar volume is compared against completed bars, so the live value can read slightly low until the bar closes.
CREDIT
The idea of judging breakouts by cumulative, time-of-day relative volume, and of reading participation as growing, holding, fading or absent, comes from a public educational video by SMB Capital on relative volume. This script is an independent Pine Script implementation of that concept.
This script is for educational and informational purposes only. It is not financial advice.
發行說明
v2: Futures roll mode (front-month-only baseline)For futures symbols, the volume baseline now restarts at every contract rollover, so only sessions of the active contract are averaged. Continuous contracts (such as NIFTY1!) otherwise mix in the previous contract's front-month days, which skews the long lookback for weeks after each expiry.
- The rollover is detected as the first session after the last <weekday> of the month (default Tuesday for NSE index futures). This also covers expiries moved earlier for a holiday.
- The long lookback grows with the contract: every completed front-month session so far, up to the configured length. The short lookback uses the last N sessions, never reaching into the previous contract.
- Until the new contract has the minimum number of sessions (default 3), the continuous history is used and the bars are greyed out as provisional.
- The table now shows the contract day and whether the baseline is front month, provisional or continuous. The cRVOL rows show the lookback actually used.
- New settings group "Futures roll": Auto / On / Off (Auto = on for futures symbols), expiry weekday, and minimum sessions.
Stocks and other non-futures symbols behave exactly as before.
Note on the opening bar
On NSE, some broker feeds include the pre-open auction volume in the 09:15 bar while TradingView's bar does not, so readings in the first 5–15 minutes can differ from broker-side calculations. Treat signals on the very first bar as indicative.

免責聲明
這些資訊和出版物並非旨在提供,也不構成TradingView提供或認可的任何形式的財務、投資、交易或其他類型的建議或推薦。請閱讀使用條款以了解更多資訊。