OPEN-SOURCE SCRIPT
已更新 CBC Table [MMT]
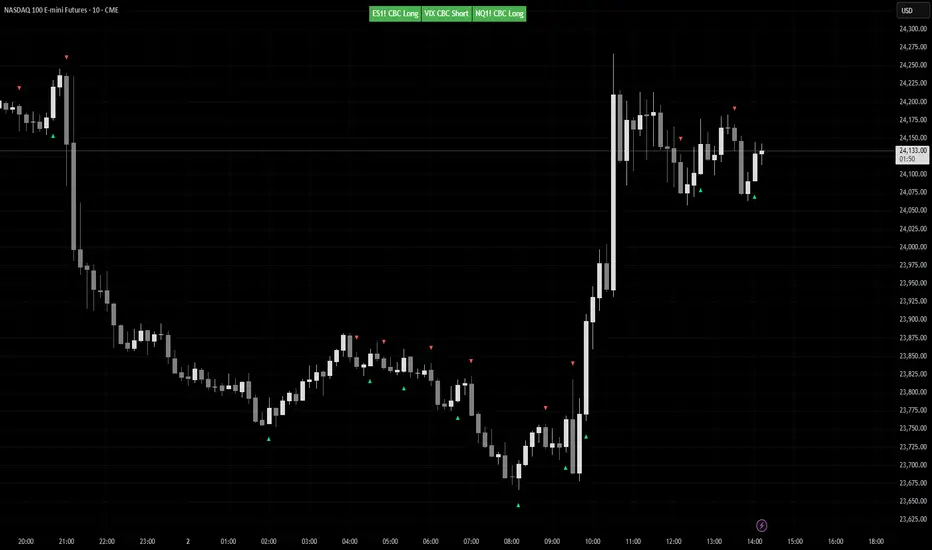
CBC Table [MMT] is a multi-asset Candle-by-Candle status table that lets you monitor confirmed CBC direction across up to three configurable symbols from one chart. It is designed to show the latest confirmed CBC state from a selected timeframe, while only displaying the table when the current chart matches one of the configured symbols.
This makes it useful for traders who want to track correlated or inverse markets such as ES/NQ/VIX, GC/DXY, or any custom asset set without hardcoding the script to one specific pair.
How it works
For each enabled symbol, the script requests data from the selected CBC timeframe and tracks whether that market is currently in a CBC bullish or bearish state based on confirmed candle closes. The status shown in the table is the latest confirmed state, so it does not flip back and forth intrabar while the higher-timeframe candle is still forming.
The script also checks whether the current chart symbol matches one of the enabled symbols. If it does, the table is shown with the CBC status for all enabled assets; if it does not, the script displays a non-matching message instead of showing unrelated pair data.
Features
How to use
Example use cases
Notes
This makes it useful for traders who want to track correlated or inverse markets such as ES/NQ/VIX, GC/DXY, or any custom asset set without hardcoding the script to one specific pair.
How it works
For each enabled symbol, the script requests data from the selected CBC timeframe and tracks whether that market is currently in a CBC bullish or bearish state based on confirmed candle closes. The status shown in the table is the latest confirmed state, so it does not flip back and forth intrabar while the higher-timeframe candle is still forming.
The script also checks whether the current chart symbol matches one of the enabled symbols. If it does, the table is shown with the CBC status for all enabled assets; if it does not, the script displays a non-matching message instead of showing unrelated pair data.
Features
- Monitor up to 3 custom symbols
- User-selectable CBC timeframe
- Symbol-based chart matching
- Confirmed-state CBC logic
- Optional inverse color handling for assets like VIX or DXY
- Dynamic table sizing based on enabled assets
- Automatic symbol label extraction from the selected ticker
- Optional candle markers for CBC flips
How to use
- Choose the timeframe you want CBC to be calculated from.
- Select up to three symbols in the settings.
- Enable or disable any asset slot as needed.
- Use invert colors for symbols that are interpreted inversely relative to your main market.
- Apply the script to one of the selected chart symbols to see the table and any flip markers.
Example use cases
- ES / NQ / VIX
- GC / DXY
- CL / XLE
- Any custom intermarket or confirmation set you want to monitor from one chart
Notes
- CBC state updates only on confirmed candles from the selected timeframe.
- Flip markers are plotted only for the currently matched chart symbol so markers stay aligned with the candles on the chart.
發行說明
Bug Fix:Remove the constraint of requiring current chart needs to be one of the tickers in the settings to show
開源腳本
秉持TradingView一貫精神,這個腳本的創作者將其設為開源,以便交易者檢視並驗證其功能。向作者致敬!您可以免費使用此腳本,但請注意,重新發佈代碼需遵守我們的社群規範。

免責聲明
這些資訊和出版物並非旨在提供,也不構成TradingView提供或認可的任何形式的財務、投資、交易或其他類型的建議或推薦。請閱讀使用條款以了解更多資訊。
開源腳本
秉持TradingView一貫精神,這個腳本的創作者將其設為開源,以便交易者檢視並驗證其功能。向作者致敬!您可以免費使用此腳本,但請注意,重新發佈代碼需遵守我們的社群規範。
免責聲明
這些資訊和出版物並非旨在提供,也不構成TradingView提供或認可的任何形式的財務、投資、交易或其他類型的建議或推薦。請閱讀使用條款以了解更多資訊。