已更新
ICT Breakers+ (M1D)
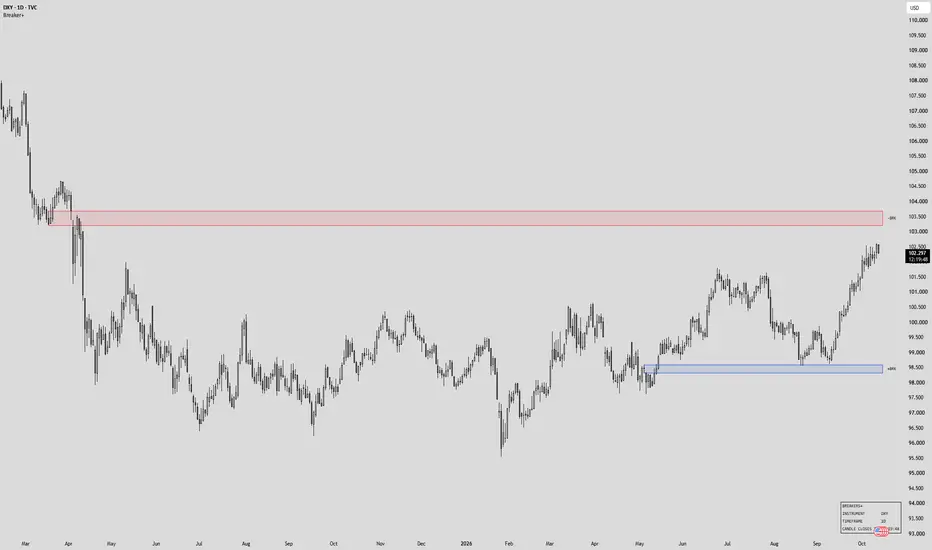
ICT Breakers+
Marks ICT's breakers on the chart's own timeframe using the Inner Circle Trader's own definition from Core Content Month 04, and nothing else. One array, drawn clean, so it can be studied on its own.
The definition it follows
Bearish below; bullish mirrors.
A old high, then a swing low. Price makes a high, pulls back to a swing low, and rallies again.
The old high is raided. The second rally trades above the first high, a false break that runs the buy stops resting there.
The swing low breaks. Price reverses and closes below the swing low between the two highs. That close is the market structure shift.
The breaker is the down-close candle at that swing low. Buyers who bought that low are now trapped. When price returns to it, they look to get out, and the old support acts as resistance.
The whole candle is the block. ICT uses the entire range of the breaker candle, wick to wick, not just the body.
The bullish breaker mirrors it: a old low, a swing high, the old low raided, then a close above that swing high. The breaker is the up-close candle at the swing high.
These are established Inner Circle Trader concepts. This script is original in its implementation of them.
What it draws
The zone. One bordered box per breaker, blue for bullish, red for bearish, from the origin candle to just past the live candle.
The tag. +BRK or -BRK on the zone's right edge, centred. Hover it for the exact range, the date it formed and whether price has traded back into it yet.
The table. Bottom right: the script name, the instrument, the timeframe and a countdown to the candle close.
Why the chart stays clean
Failure erases. A close through the far side of the candle removes the breaker.
One zone per price area. A breaker that overlaps one already drawn is not drawn. Its details join the drawn zone's tooltip instead.
One per side by default. The newest live bullish breaker and the newest live bearish breaker. Raise it in the settings.
Method and repainting
All detection runs on closed candles, so nothing appears or disappears while a candle is forming. Swing points come from a standard pivot and confirm the set number of candles after they print, which is inherent to pivot detection. A swing that waits too long for its break is retired. Alerts fire once per bar close when a breaker forms.
Settings
Detection: swing strength, which sides to show and how many breakers per side.
Style: bullish and bearish colours, zone fill, right offset and one text size for labels and table.
Table: on or off, and its position.
Analytics only
This is a study tool. It marks a structure and the block that structure leaves behind. It contains no buy or sell signals, and its alerts announce that a breaker formed; they are notifications, not trade instructions.
Disclaimer
This is a decision-support tool for discretionary ICT trading. It is not financial advice, and no market's past behaviour is indicative of future results.
Marks ICT's breakers on the chart's own timeframe using the Inner Circle Trader's own definition from Core Content Month 04, and nothing else. One array, drawn clean, so it can be studied on its own.
The definition it follows
Bearish below; bullish mirrors.
A old high, then a swing low. Price makes a high, pulls back to a swing low, and rallies again.
The old high is raided. The second rally trades above the first high, a false break that runs the buy stops resting there.
The swing low breaks. Price reverses and closes below the swing low between the two highs. That close is the market structure shift.
The breaker is the down-close candle at that swing low. Buyers who bought that low are now trapped. When price returns to it, they look to get out, and the old support acts as resistance.
The whole candle is the block. ICT uses the entire range of the breaker candle, wick to wick, not just the body.
The bullish breaker mirrors it: a old low, a swing high, the old low raided, then a close above that swing high. The breaker is the up-close candle at the swing high.
These are established Inner Circle Trader concepts. This script is original in its implementation of them.
What it draws
The zone. One bordered box per breaker, blue for bullish, red for bearish, from the origin candle to just past the live candle.
The tag. +BRK or -BRK on the zone's right edge, centred. Hover it for the exact range, the date it formed and whether price has traded back into it yet.
The table. Bottom right: the script name, the instrument, the timeframe and a countdown to the candle close.
Why the chart stays clean
Failure erases. A close through the far side of the candle removes the breaker.
One zone per price area. A breaker that overlaps one already drawn is not drawn. Its details join the drawn zone's tooltip instead.
One per side by default. The newest live bullish breaker and the newest live bearish breaker. Raise it in the settings.
Method and repainting
All detection runs on closed candles, so nothing appears or disappears while a candle is forming. Swing points come from a standard pivot and confirm the set number of candles after they print, which is inherent to pivot detection. A swing that waits too long for its break is retired. Alerts fire once per bar close when a breaker forms.
Settings
Detection: swing strength, which sides to show and how many breakers per side.
Style: bullish and bearish colours, zone fill, right offset and one text size for labels and table.
Table: on or off, and its position.
Analytics only
This is a study tool. It marks a structure and the block that structure leaves behind. It contains no buy or sell signals, and its alerts announce that a breaker formed; they are notifications, not trade instructions.
Disclaimer
This is a decision-support tool for discretionary ICT trading. It is not financial advice, and no market's past behaviour is indicative of future results.
發行說明
90 minute charts named correctlyOn a 90 minute chart the timeframe tag read 1H. It now reads 90m. Every other timeframe already read correctly. The breakers and settings are unchanged.

免責聲明
這些資訊和出版物並非旨在提供,也不構成TradingView提供或認可的任何形式的財務、投資、交易或其他類型的建議或推薦。請閱讀使用條款以了解更多資訊。