OPEN-SOURCE SCRIPT
STOC - Adaptive Opening Range Breakout
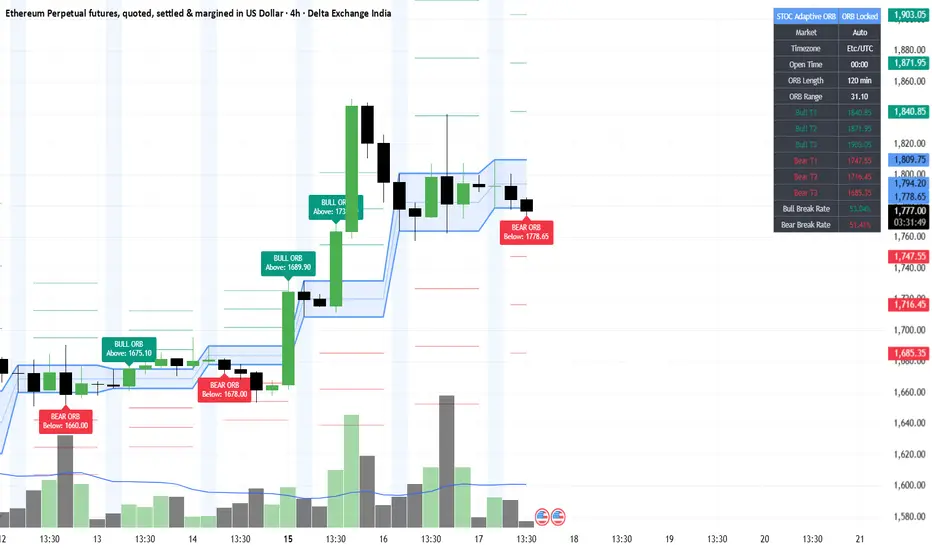
STOC Adaptive ORB is an Opening Range Breakout indicator designed to automatically build the opening range based on the active chart, market timing, and selected timeframe.
The indicator identifies the market’s opening range, plots the ORB high, ORB low, midpoint, breakout levels, and projected bullish/bearish targets. It is built for traders who want a clean, rule-based view of intraday breakout structure without manually adjusting the ORB session every time they switch symbols or timeframes.
Key Features
Adaptive Opening Range
The indicator automatically detects the market/session logic and builds the ORB from the opening period. It can be used across crypto, Indian markets, US stocks, and custom sessions.
Timeframe-Based ORB Length
The ORB duration adapts based on the chart timeframe. Lower timeframes use shorter ORB periods, while higher intraday timeframes use wider ORB windows.
Bullish and Bearish Breakout Detection
The indicator highlights when price breaks above the ORB high or below the ORB low.
Target Projection
The dashboard displays projected target values:
Bull T1, T2, T3
Bear T1, T2, T3
Targets are calculated using the opening range size as the base.
Clean Dashboard
The dashboard shows:
Market mode
Timezone
Open time
ORB length
ORB range
Bullish target values
Bearish target values
Bull breakout rate
Bear breakout rate
Visual ORB Zone
The opening range is clearly marked on the chart with a filled range box, making it easier to identify the breakout zone.
Multi-Market Use
Suitable for:
Crypto
NSE / BSE
US stocks
London market
Custom open sessions
How to Use
Use the ORB high and ORB low as the main breakout levels.
A bullish breakout happens when price moves above the ORB high.
A bearish breakout happens when price moves below the ORB low.
Bullish targets are plotted above the ORB high. Bearish targets are plotted below the ORB low.
The indicator is best used with additional confirmation such as trend, volume, VWAP, CPR, or higher-timeframe market structure.
Suggested Use Cases
Intraday breakout trading
Crypto session breakout tracking
Stock market opening range analysis
Backtesting ORB behavior across symbols
Identifying high-probability breakout zones
Tracking target levels after an ORB breakout
Best Timeframes
Recommended timeframes:
5m
15m
30m
1H
For crypto, it can also be used on 2H or 4H charts with wider ORB logic.
Disclaimer
This indicator is the intellectual property of Systematic Traders Official Club.Distribution, modification, or commercial use without permission is prohibited.
This indicator is provided for educational and informational purposes only. It does not constitute financial advice, investment recommendations, or trade signals.
The creator and Systematic Traders Official Club are not responsible for any financial losses resulting from the use of this indicator. Trading involves risk, and users should do their own research before making any trading decisions.
The indicator identifies the market’s opening range, plots the ORB high, ORB low, midpoint, breakout levels, and projected bullish/bearish targets. It is built for traders who want a clean, rule-based view of intraday breakout structure without manually adjusting the ORB session every time they switch symbols or timeframes.
Key Features
Adaptive Opening Range
The indicator automatically detects the market/session logic and builds the ORB from the opening period. It can be used across crypto, Indian markets, US stocks, and custom sessions.
Timeframe-Based ORB Length
The ORB duration adapts based on the chart timeframe. Lower timeframes use shorter ORB periods, while higher intraday timeframes use wider ORB windows.
Bullish and Bearish Breakout Detection
The indicator highlights when price breaks above the ORB high or below the ORB low.
Target Projection
The dashboard displays projected target values:
Bull T1, T2, T3
Bear T1, T2, T3
Targets are calculated using the opening range size as the base.
Clean Dashboard
The dashboard shows:
Market mode
Timezone
Open time
ORB length
ORB range
Bullish target values
Bearish target values
Bull breakout rate
Bear breakout rate
Visual ORB Zone
The opening range is clearly marked on the chart with a filled range box, making it easier to identify the breakout zone.
Multi-Market Use
Suitable for:
Crypto
NSE / BSE
US stocks
London market
Custom open sessions
How to Use
Use the ORB high and ORB low as the main breakout levels.
A bullish breakout happens when price moves above the ORB high.
A bearish breakout happens when price moves below the ORB low.
Bullish targets are plotted above the ORB high. Bearish targets are plotted below the ORB low.
The indicator is best used with additional confirmation such as trend, volume, VWAP, CPR, or higher-timeframe market structure.
Suggested Use Cases
Intraday breakout trading
Crypto session breakout tracking
Stock market opening range analysis
Backtesting ORB behavior across symbols
Identifying high-probability breakout zones
Tracking target levels after an ORB breakout
Best Timeframes
Recommended timeframes:
5m
15m
30m
1H
For crypto, it can also be used on 2H or 4H charts with wider ORB logic.
Disclaimer
This indicator is the intellectual property of Systematic Traders Official Club.Distribution, modification, or commercial use without permission is prohibited.
This indicator is provided for educational and informational purposes only. It does not constitute financial advice, investment recommendations, or trade signals.
The creator and Systematic Traders Official Club are not responsible for any financial losses resulting from the use of this indicator. Trading involves risk, and users should do their own research before making any trading decisions.
開源腳本
秉持TradingView一貫精神,這個腳本的創作者將其設為開源,以便交易者檢視並驗證其功能。向作者致敬!您可以免費使用此腳本,但請注意,重新發佈代碼需遵守我們的社群規範。

Building STOC: Systematic and Rule Based Trading - Crypto, Commodities, India & Global Investments.
免責聲明
這些資訊和出版物並非旨在提供,也不構成TradingView提供或認可的任何形式的財務、投資、交易或其他類型的建議或推薦。請閱讀使用條款以了解更多資訊。
開源腳本
秉持TradingView一貫精神,這個腳本的創作者將其設為開源,以便交易者檢視並驗證其功能。向作者致敬!您可以免費使用此腳本,但請注意,重新發佈代碼需遵守我們的社群規範。
Building STOC: Systematic and Rule Based Trading - Crypto, Commodities, India & Global Investments.
免責聲明
這些資訊和出版物並非旨在提供,也不構成TradingView提供或認可的任何形式的財務、投資、交易或其他類型的建議或推薦。請閱讀使用條款以了解更多資訊。