Weekly/Daily Levels & 30m Supply/Demand
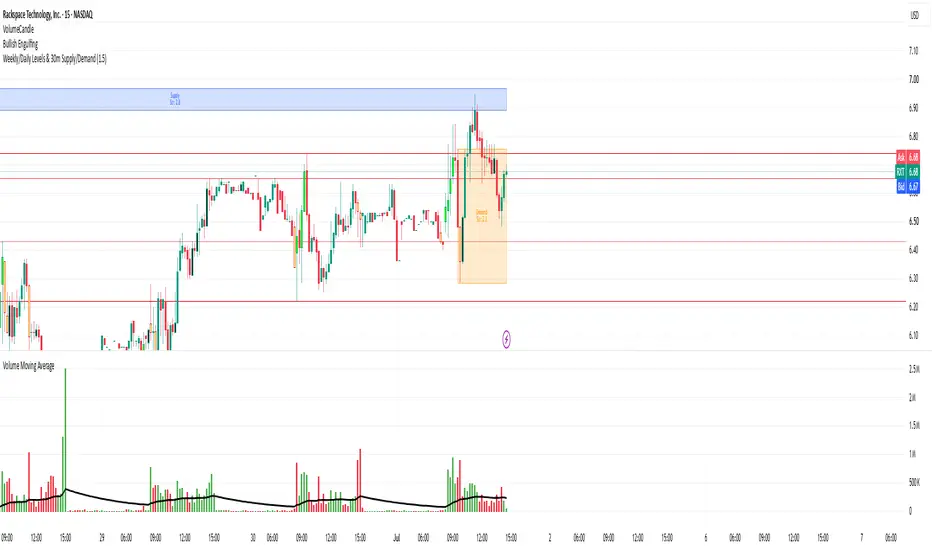
Here is a concise and professional description you can use to publish your indicator on TradingView:
**Daily and Weekly Levels & 30m Supply/Demand**
This indicator provides a clean, automated map of key higher timeframe liquidity levels and short-term supply/demand zones without cluttering your chart.
**Key Features:**
* **Static Daily and Weekly Liquidity Levels:** Automatically plots straight, extended horizontal lines for the Previous Week's High/Low (Aqua) and the Previous 3 Days' Highs/Lows (shades of Red). These lines remain static regardless of your current chart timeframe.
* **30-Minute S/D Zones:** Independently analyzes 30-minute price action in the background to detect powerful market imbalances. It identifies "base" candles followed by explosive moves (measured via ATR) to draw Supply (Blue) and Demand (Orange) zones.
* **Strength Labels & Filtering:** Each zone displays a "Strength" multiplier based on the size of the explosive move. The script intelligently filters out overlapping zones to keep the chart clean.
* **Dynamic Mitigation:** Zones are continuously monitored and automatically deleted from the chart once price breaks and closes beyond them, ensuring you are only looking at fresh, unbroken levels.
**Usage:**
Perfect for day traders and swing traders who want to combine macro daily/weekly liquidity targets with precise 30m entry/exit zones. Adjust the "Explosive Move ATR Multiplier" in the settings to filter for stronger or weaker zone creations.

免責聲明
這些資訊和出版物並非旨在提供,也不構成TradingView提供或認可的任何形式的財務、投資、交易或其他類型的建議或推薦。請閱讀使用條款以了解更多資訊。